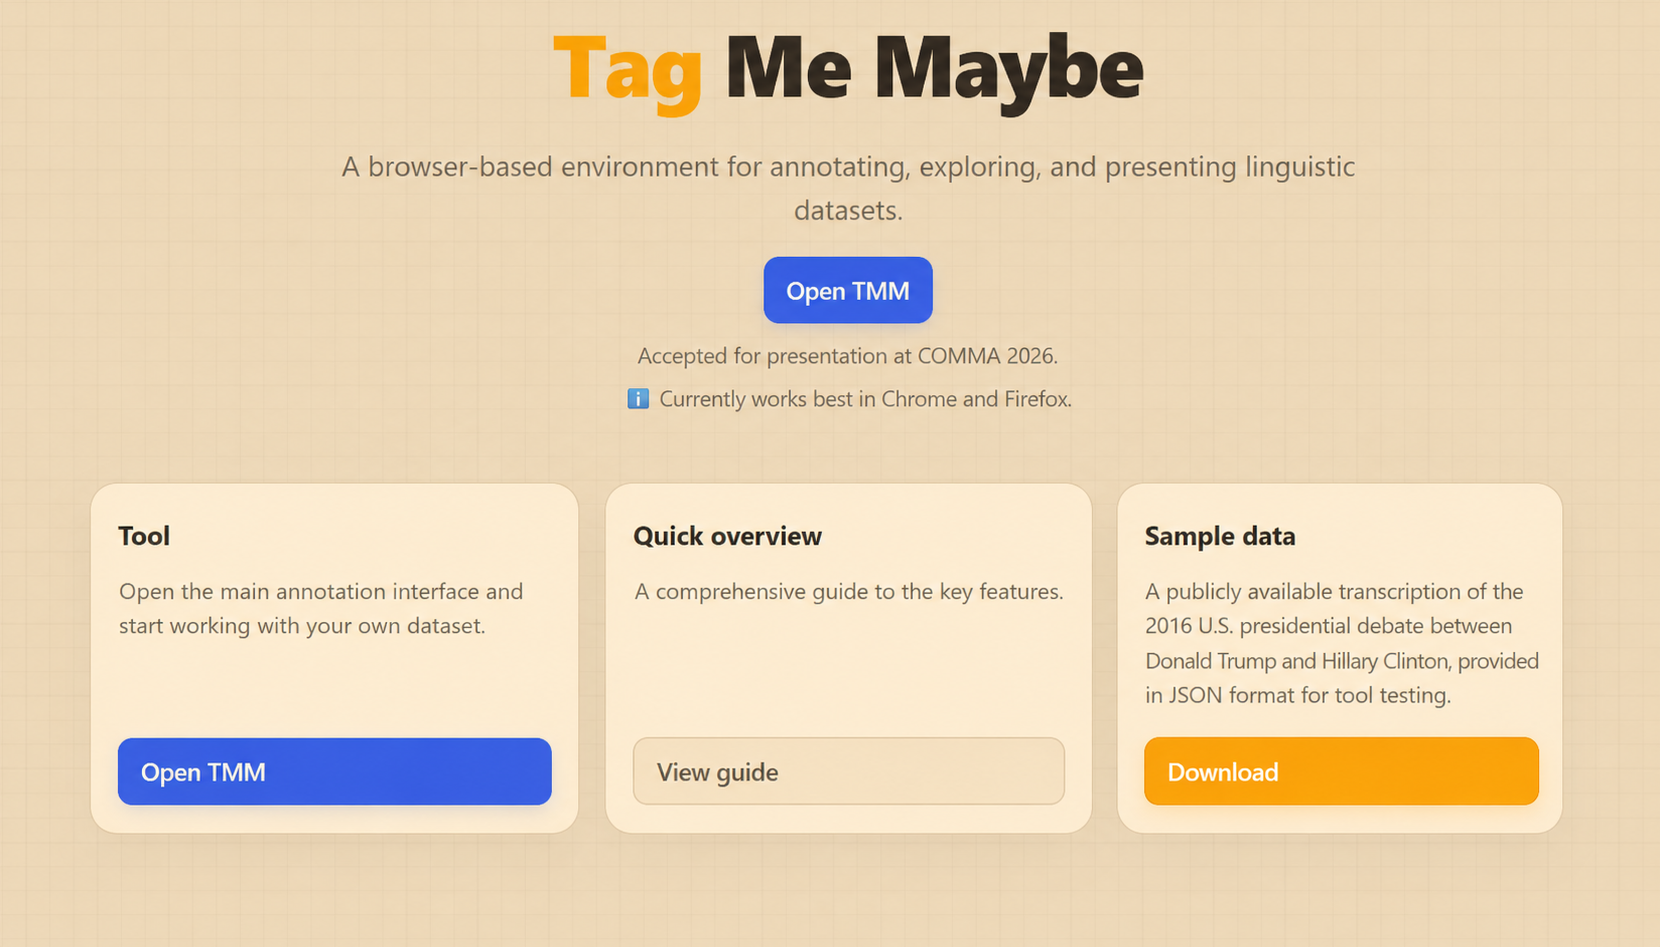
Welcome to Tag Me Maybe - an environment for creating, analysing and presenting linguistic datasets. The application requires no installation and is fully accessible in a web browser.
The application consists of the following modules:
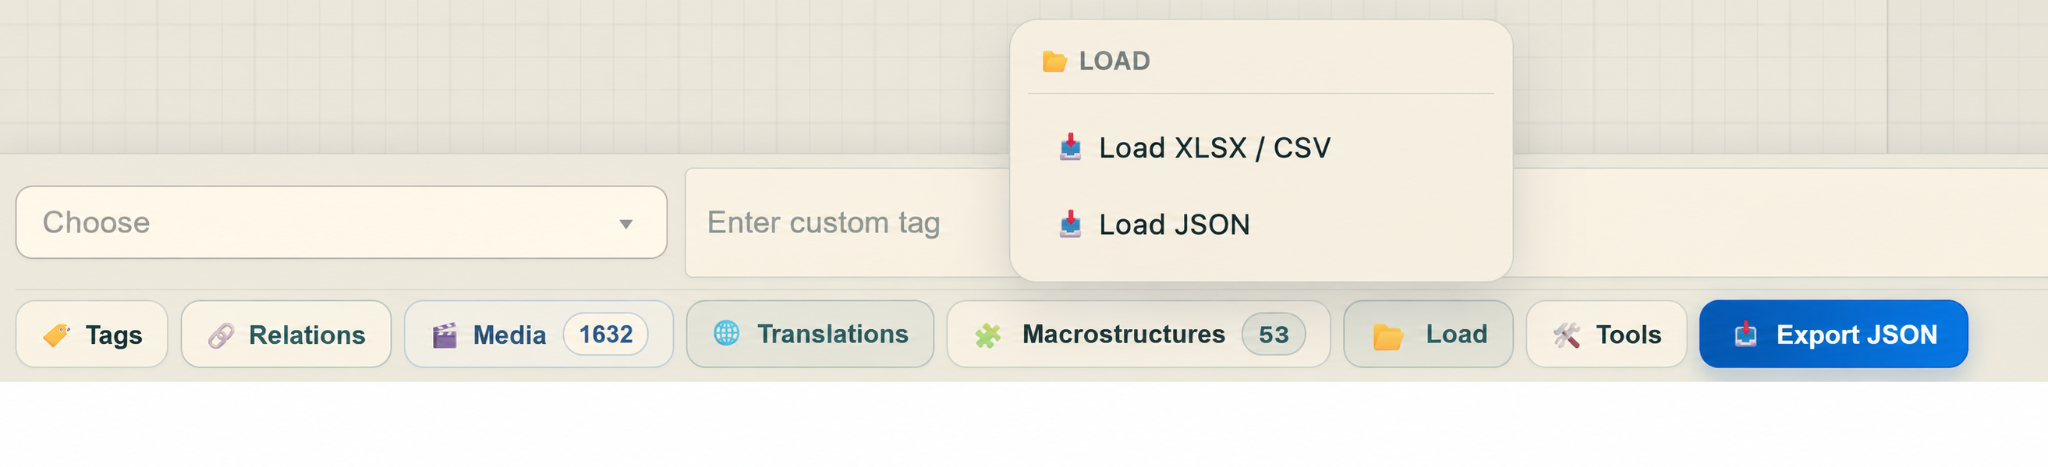
Use JSON to restore a complete TMM state, including segments, annotations, relations, tag settings and other project data.
💡 Safety: TMM validates imported data before replacing the currently loaded project.
Annotation · 02
Annotation basics
In TMM, the text is divided into segments: basic textual units visible in the left column. On their basis, you can create one or more annotations displayed on the right.
A segment is a fragment of the source text, while an annotation (tags + relations) is information about the text.
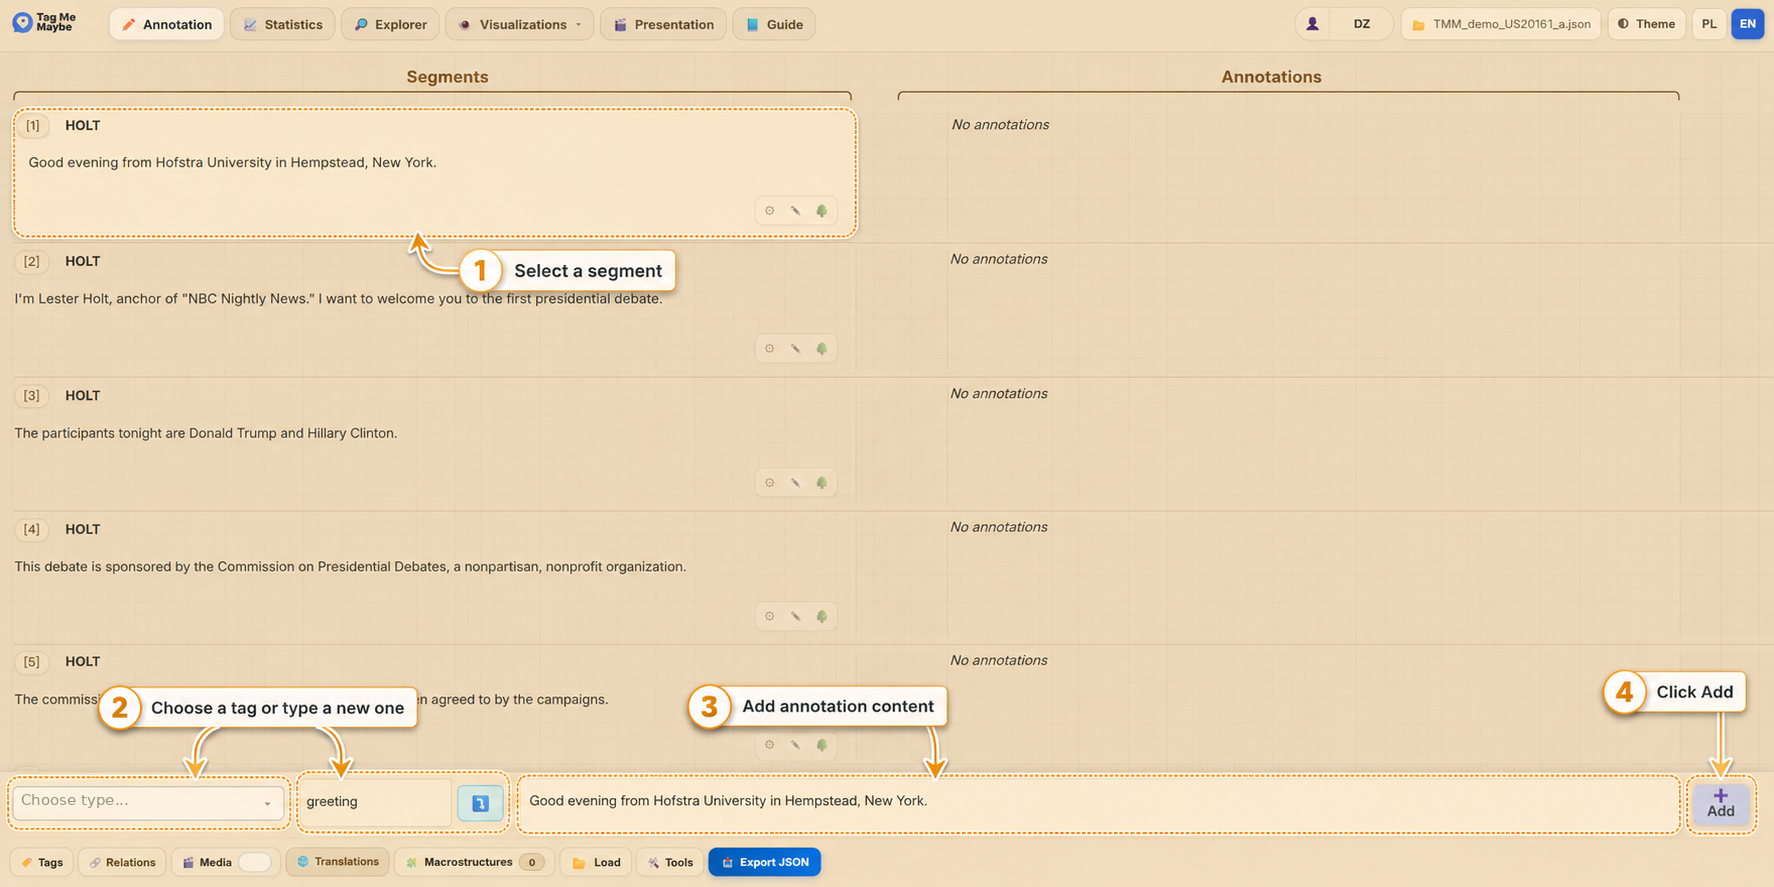
To create a tag:
Click a segment in the left column to select it. It will be subtly highlighted.
Choose an existing tag name or type your own.
Add the annotation content.
Confirm by clicking ➕ Add.
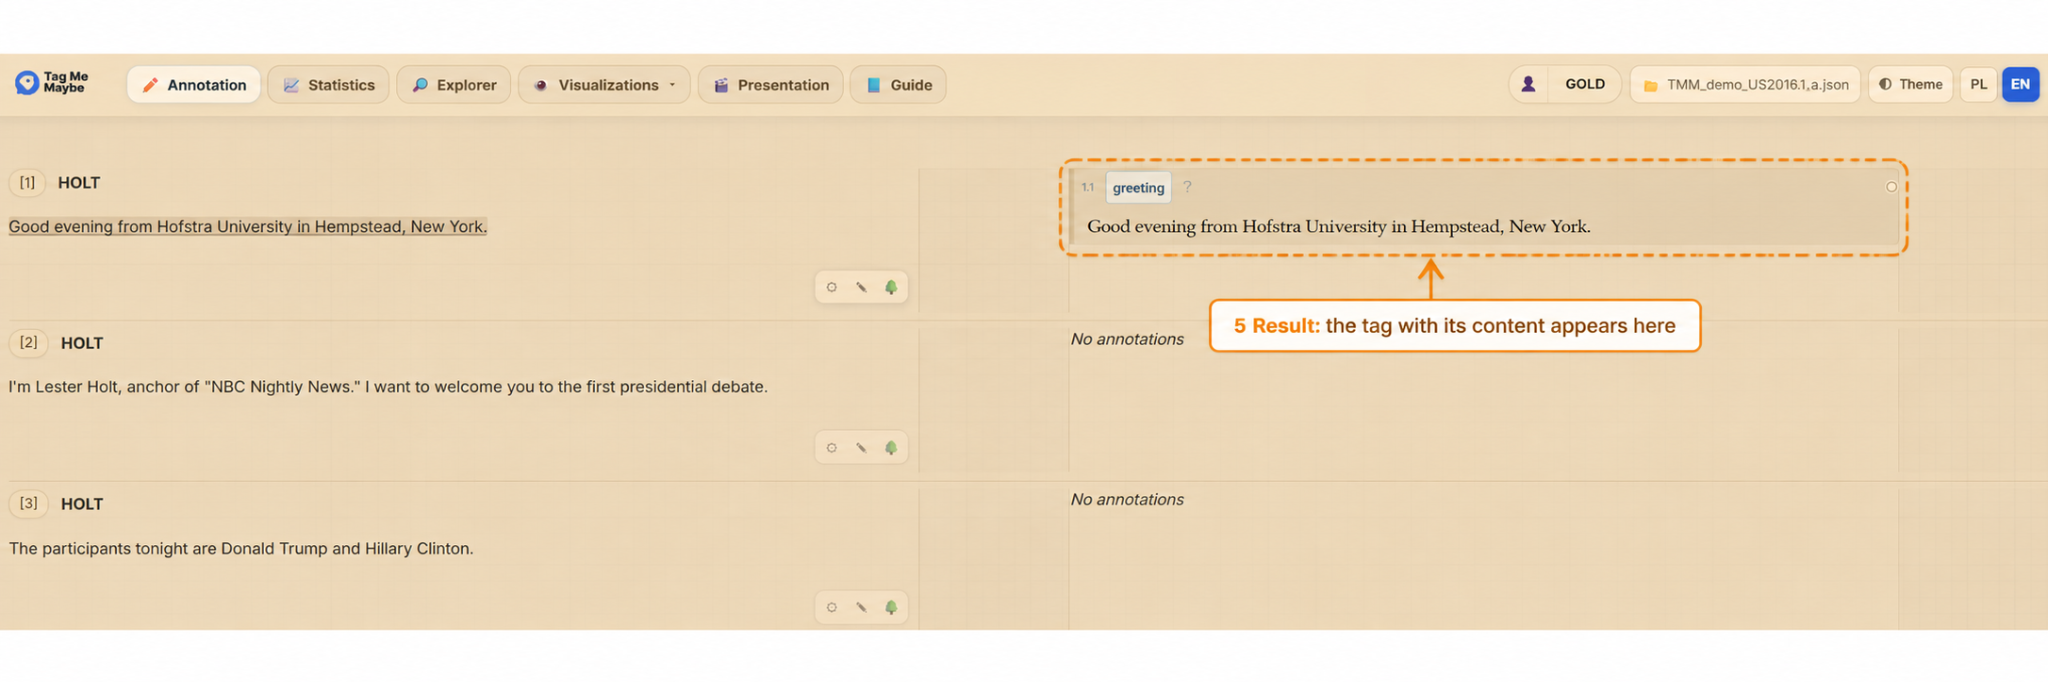
The screenshot highlights the key elements of the workflow: selecting a segment, choosing a tag, adding annotation content and confirming with Add.After you confirm the operation, the new annotation appears in the right column together with its tag and content.
💡 Tip: Use multiple annotations when one segment performs several functions or contains analytically distinct spans.
Annotation · 03
Annotation hierarchy
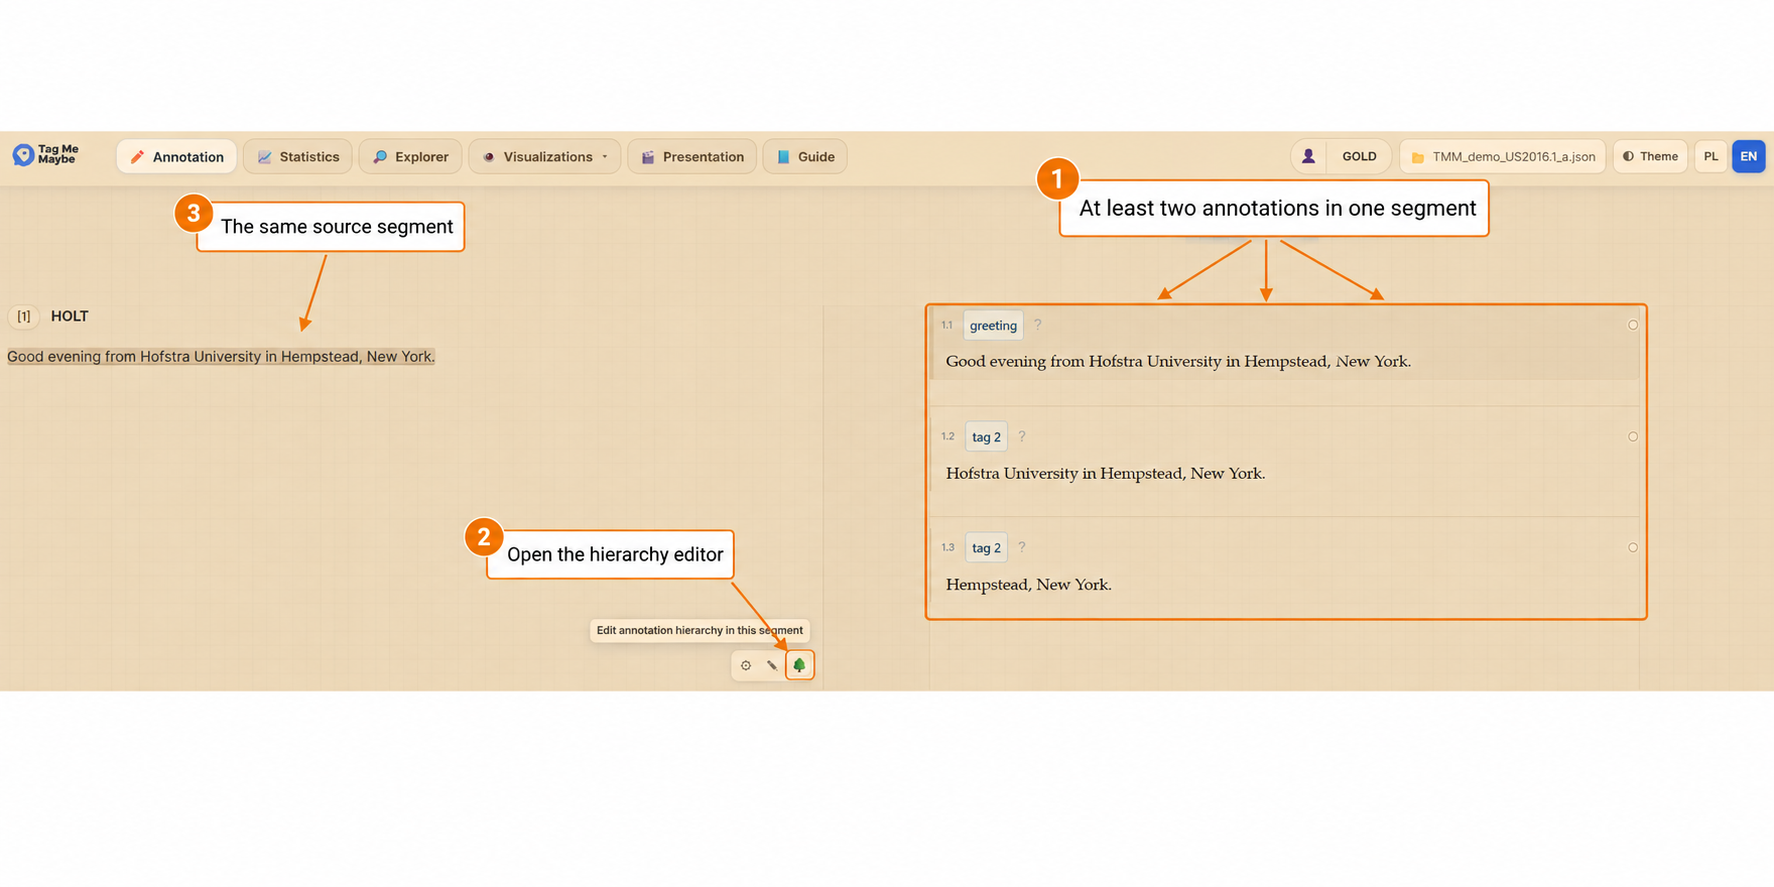
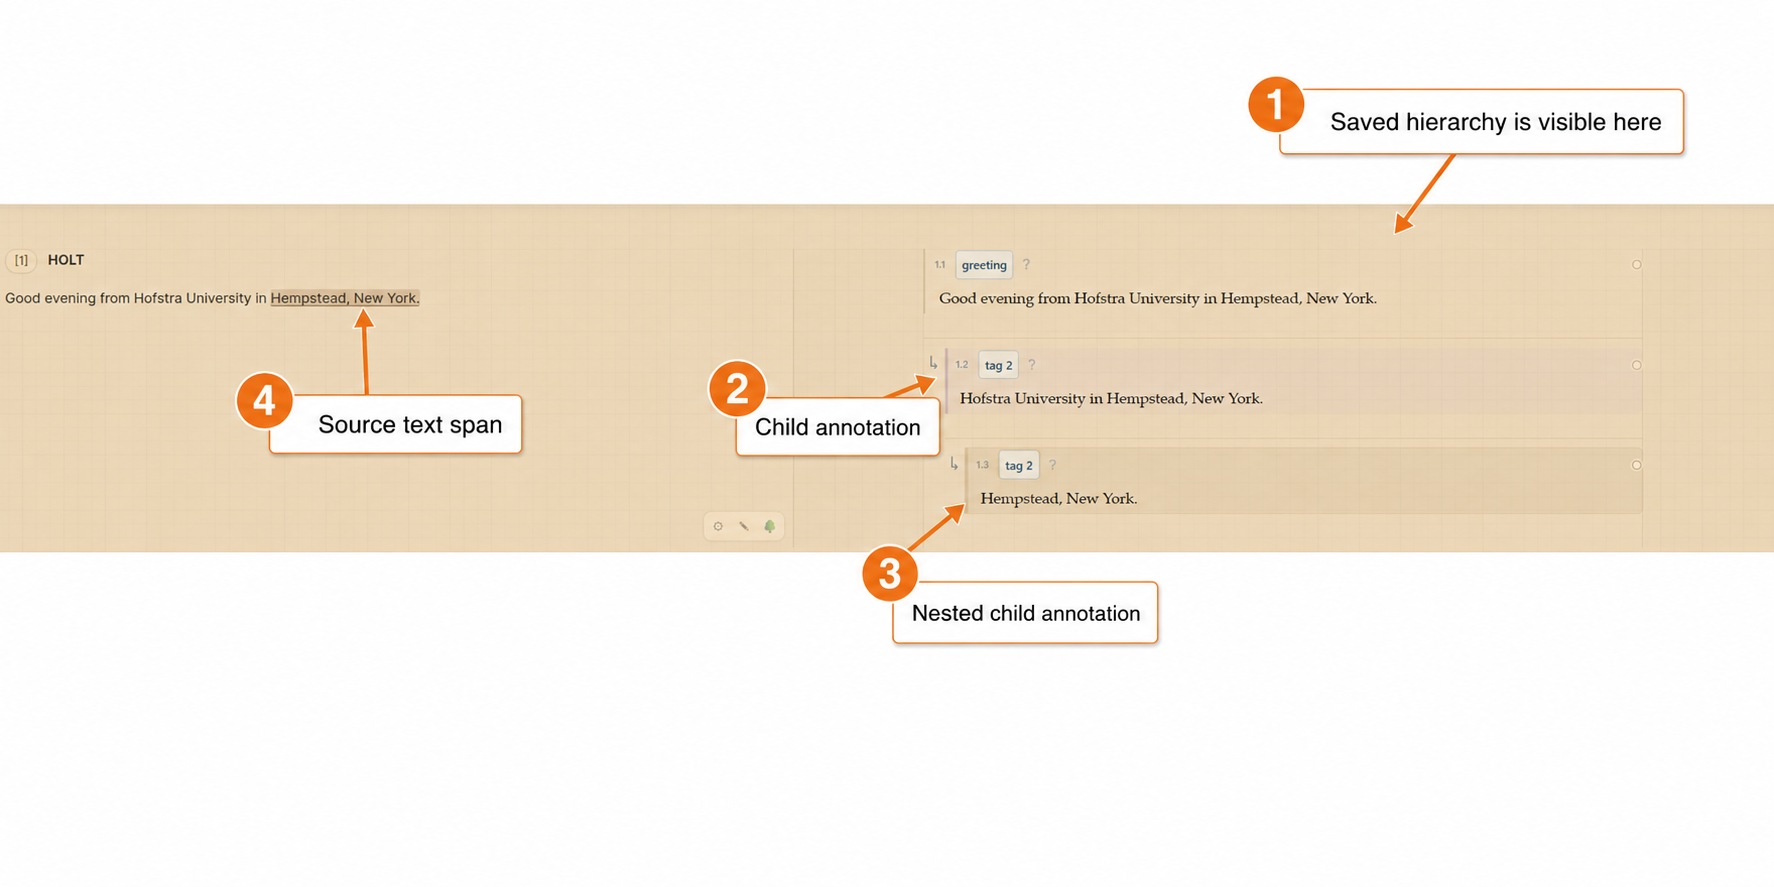
In TMM you can define hierarchy between annotations. To do this, create at least two annotations within a single segment, then click the tree icon and set the appropriate dependency.
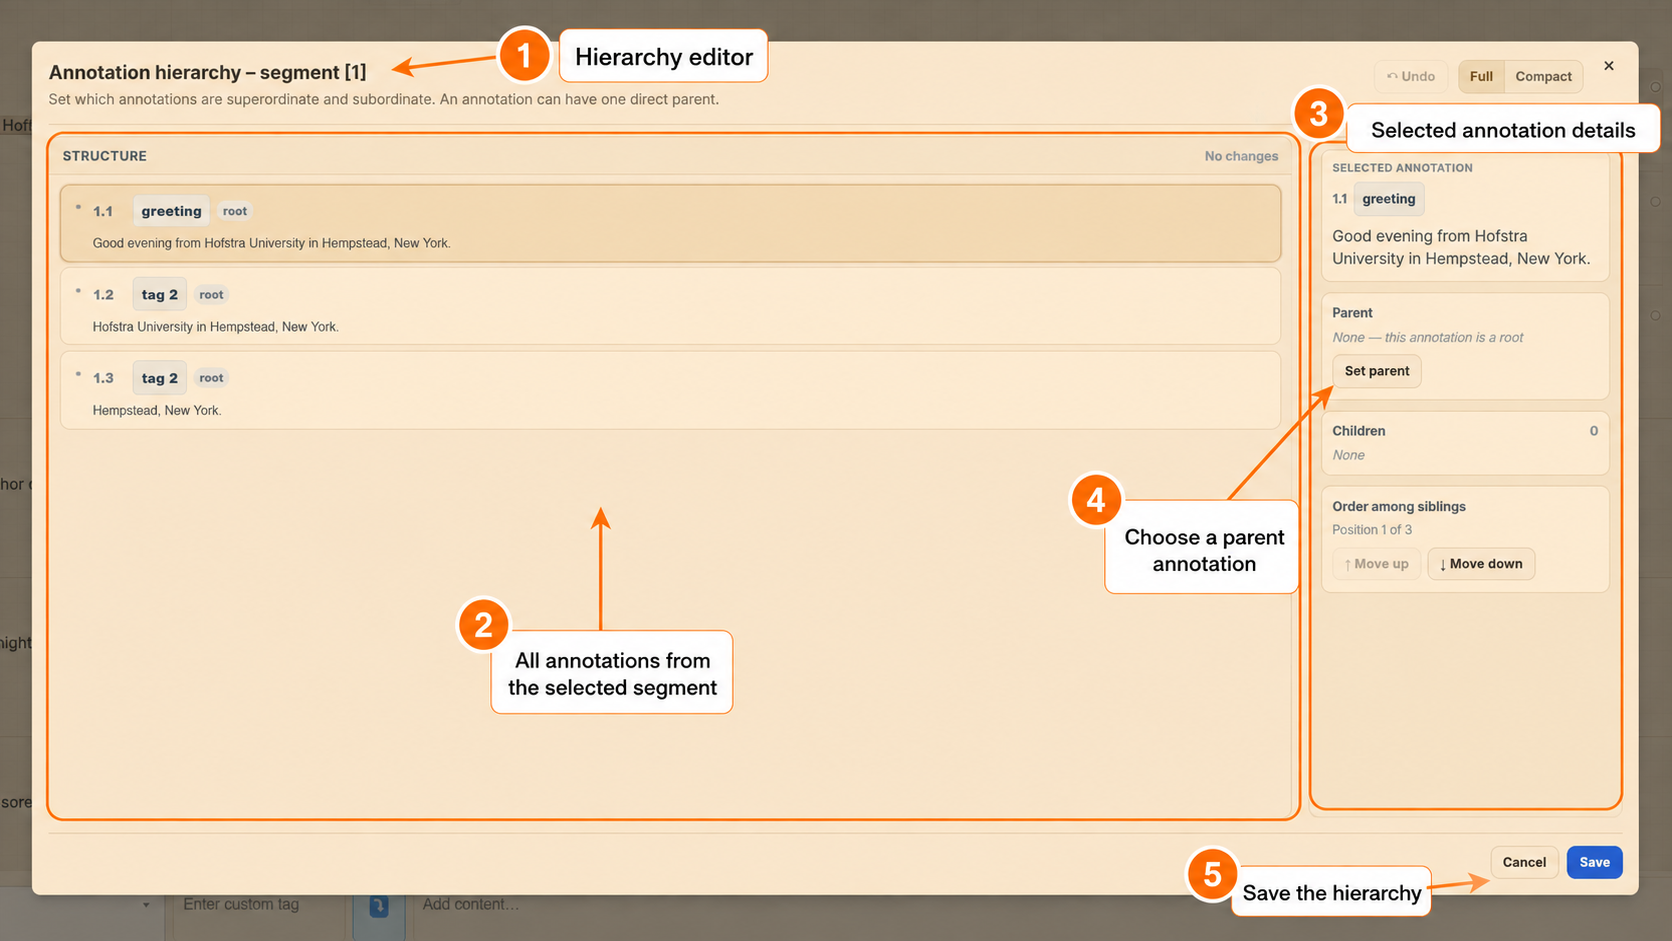
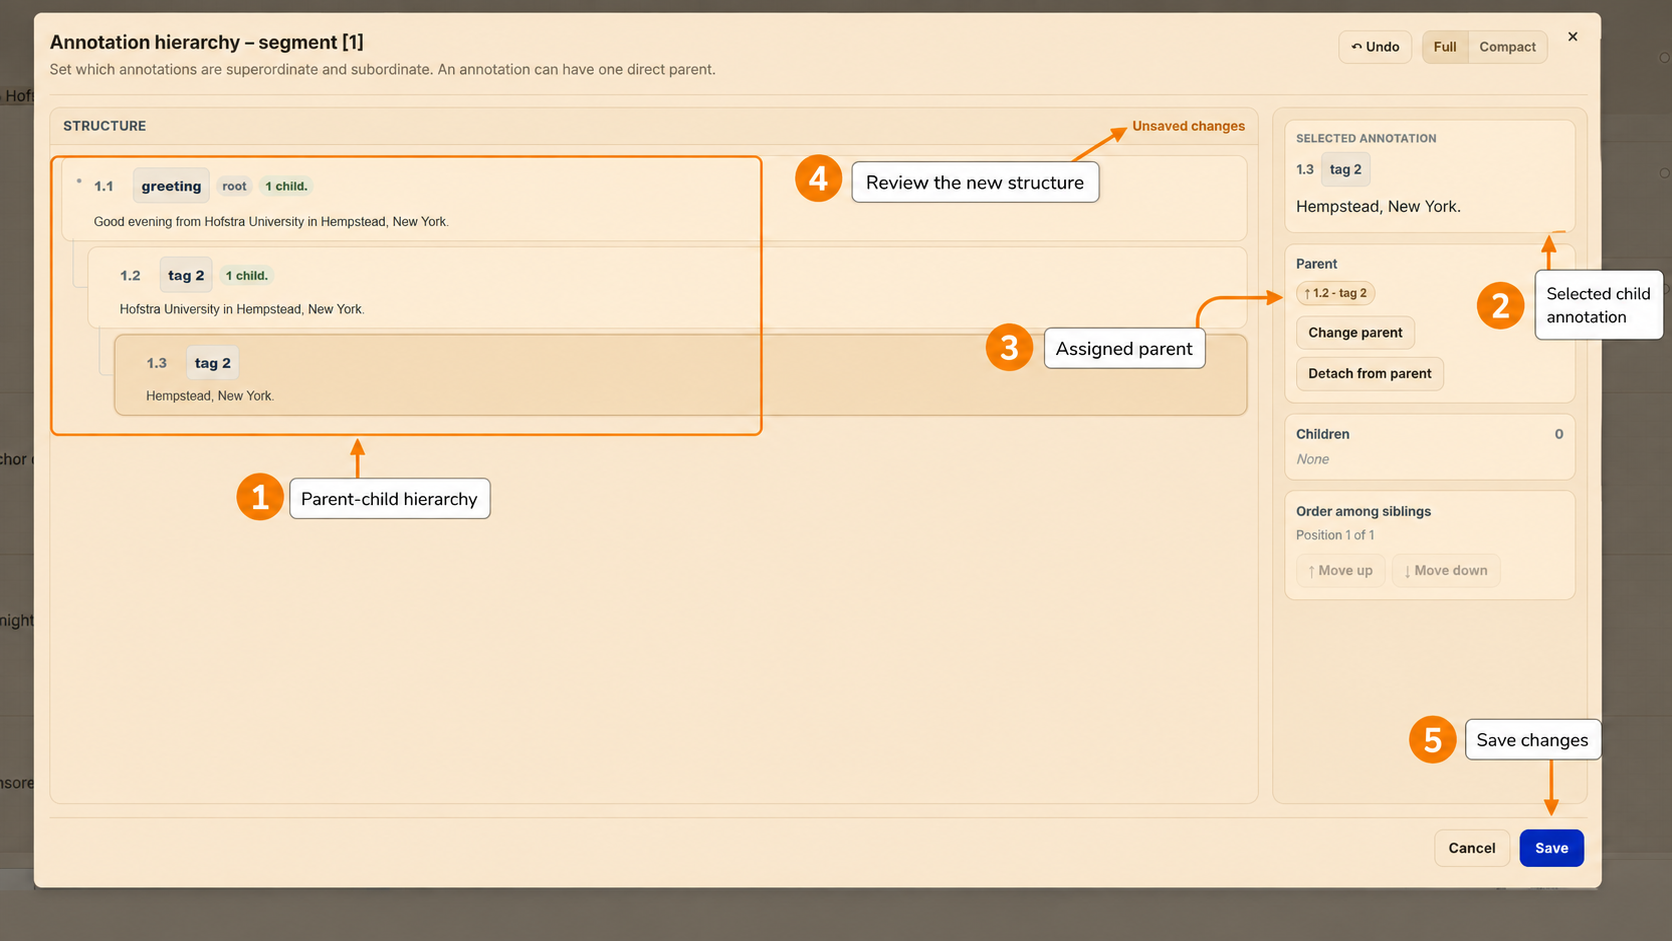
First create at least two annotations within one segment, then click the tree icon.The hierarchy editor opens and shows all annotations from the selected segment.Set the parent-child relation and save the changes.After saving, the hierarchy becomes visible directly in the annotation panel.
Annotation · 04
Macrostructures
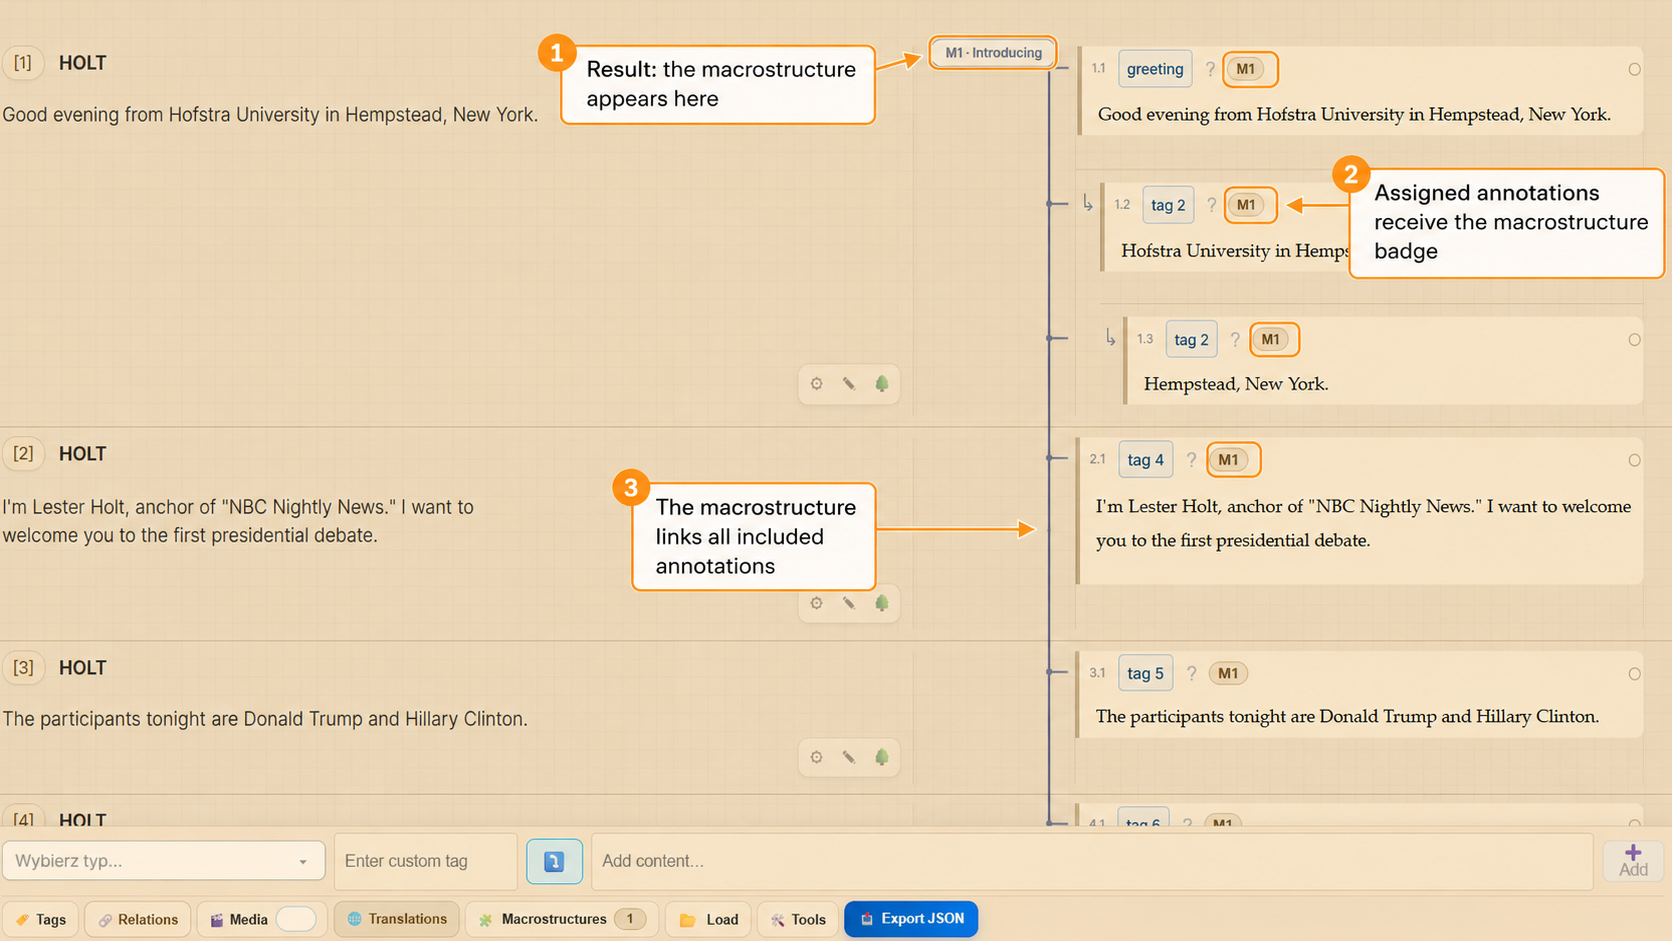
Macrostructures group annotations into larger discourse units. They are useful when the object of analysis extends beyond a single segment. A macrostructure may be discontinuous and may also be nested within another macrostructure.
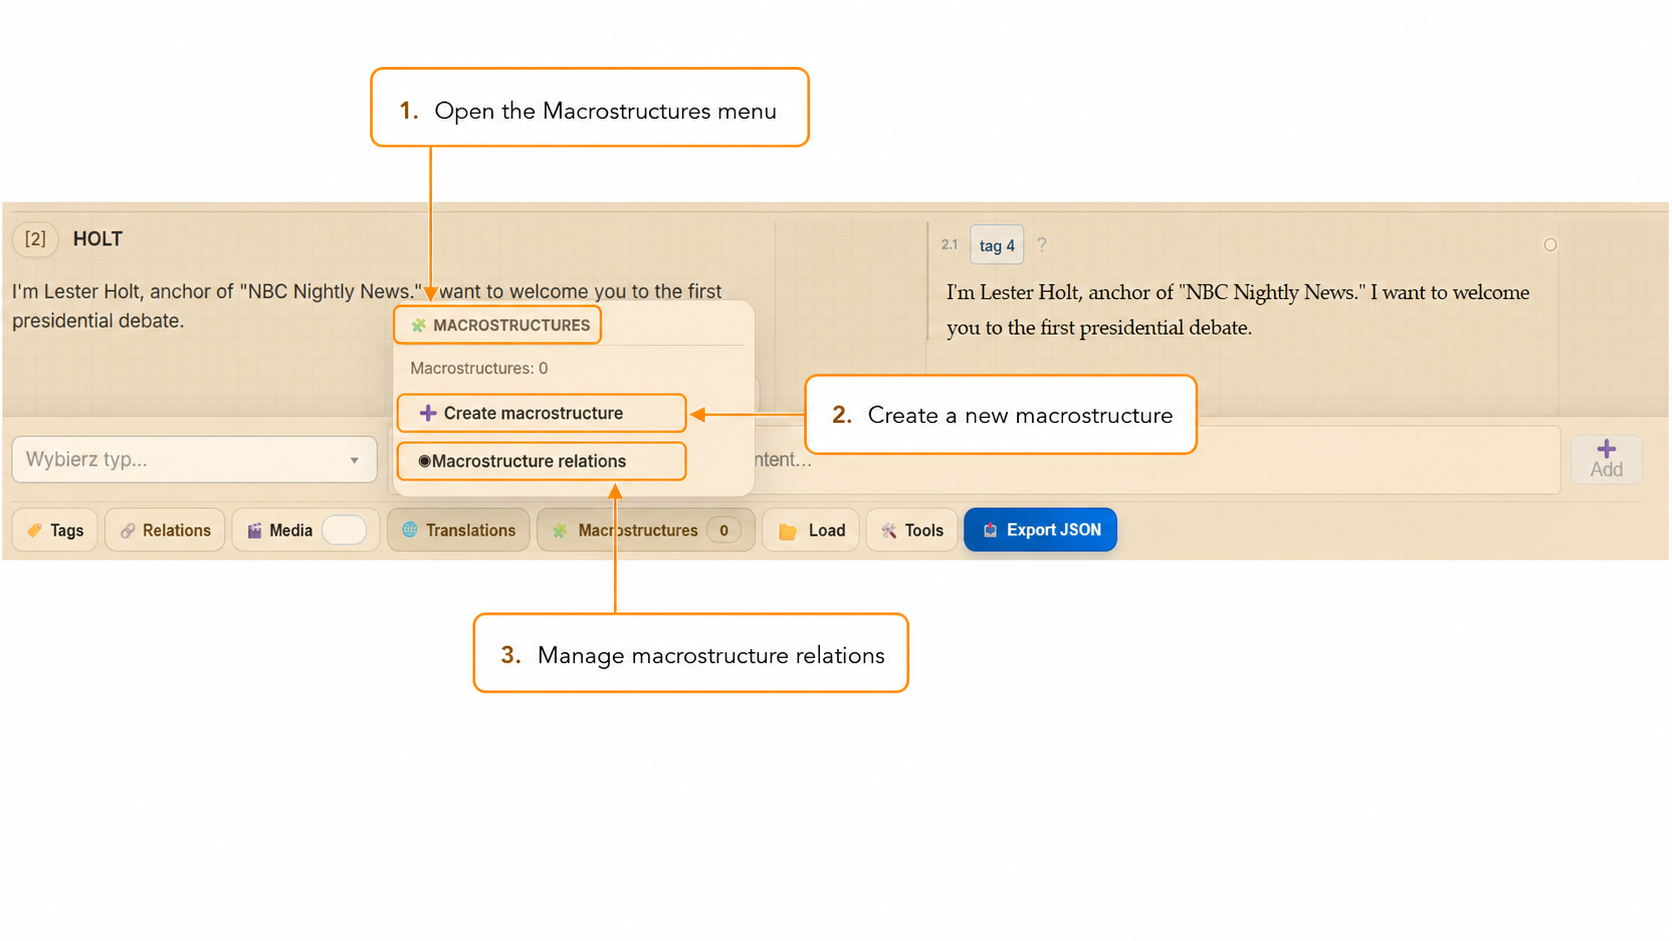
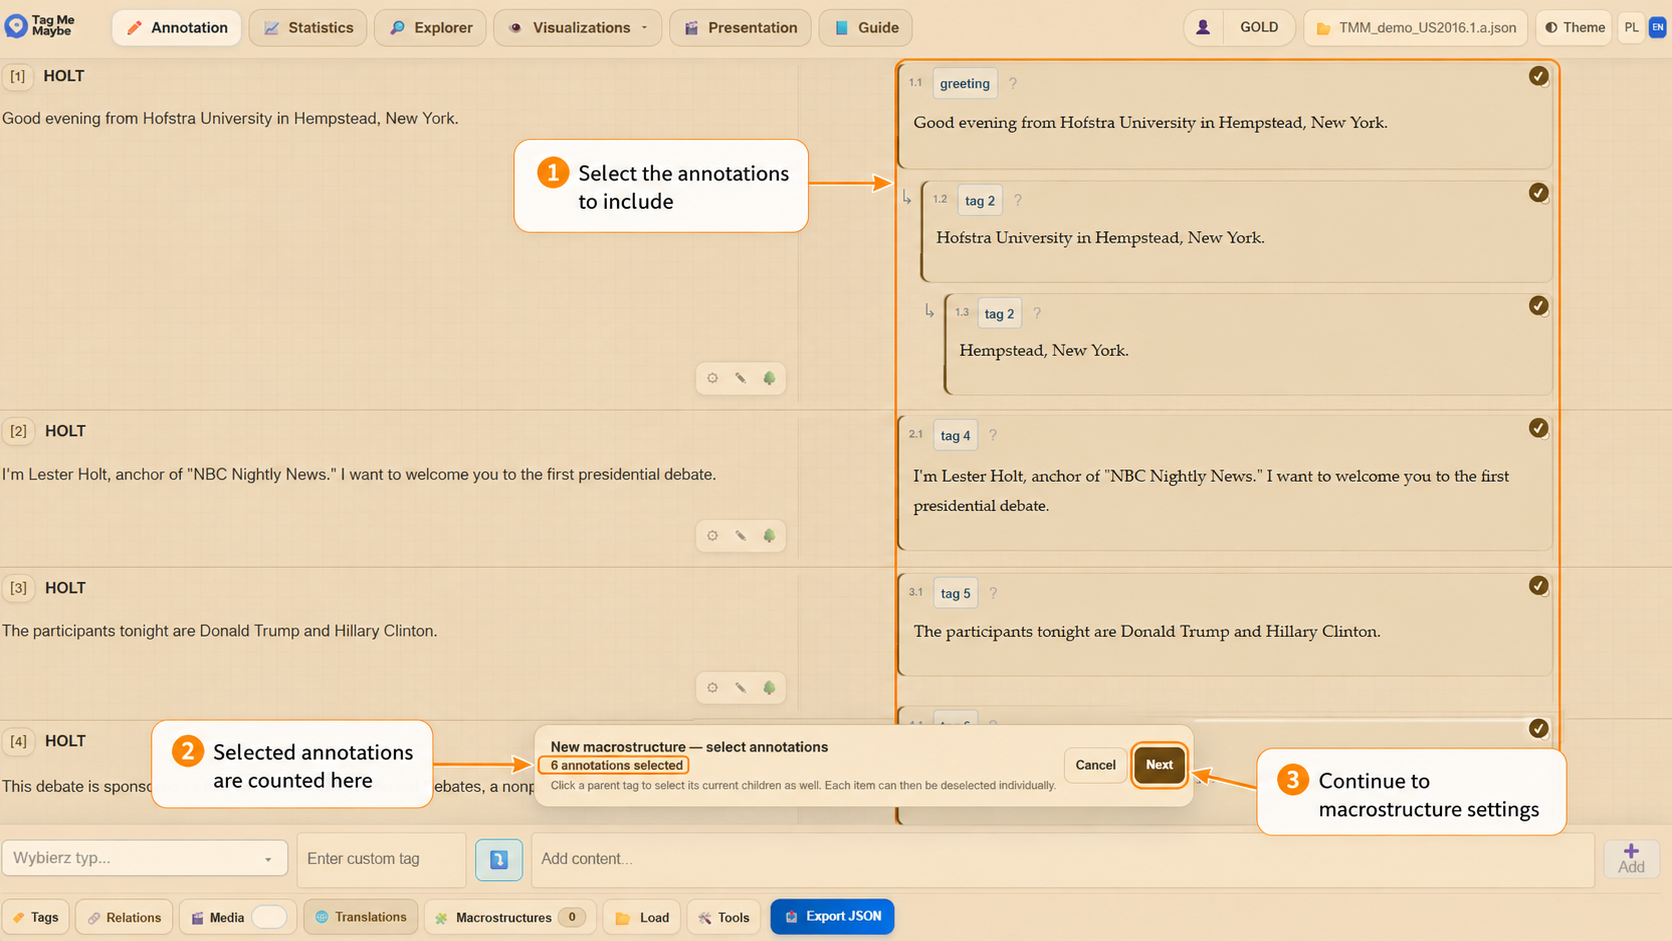
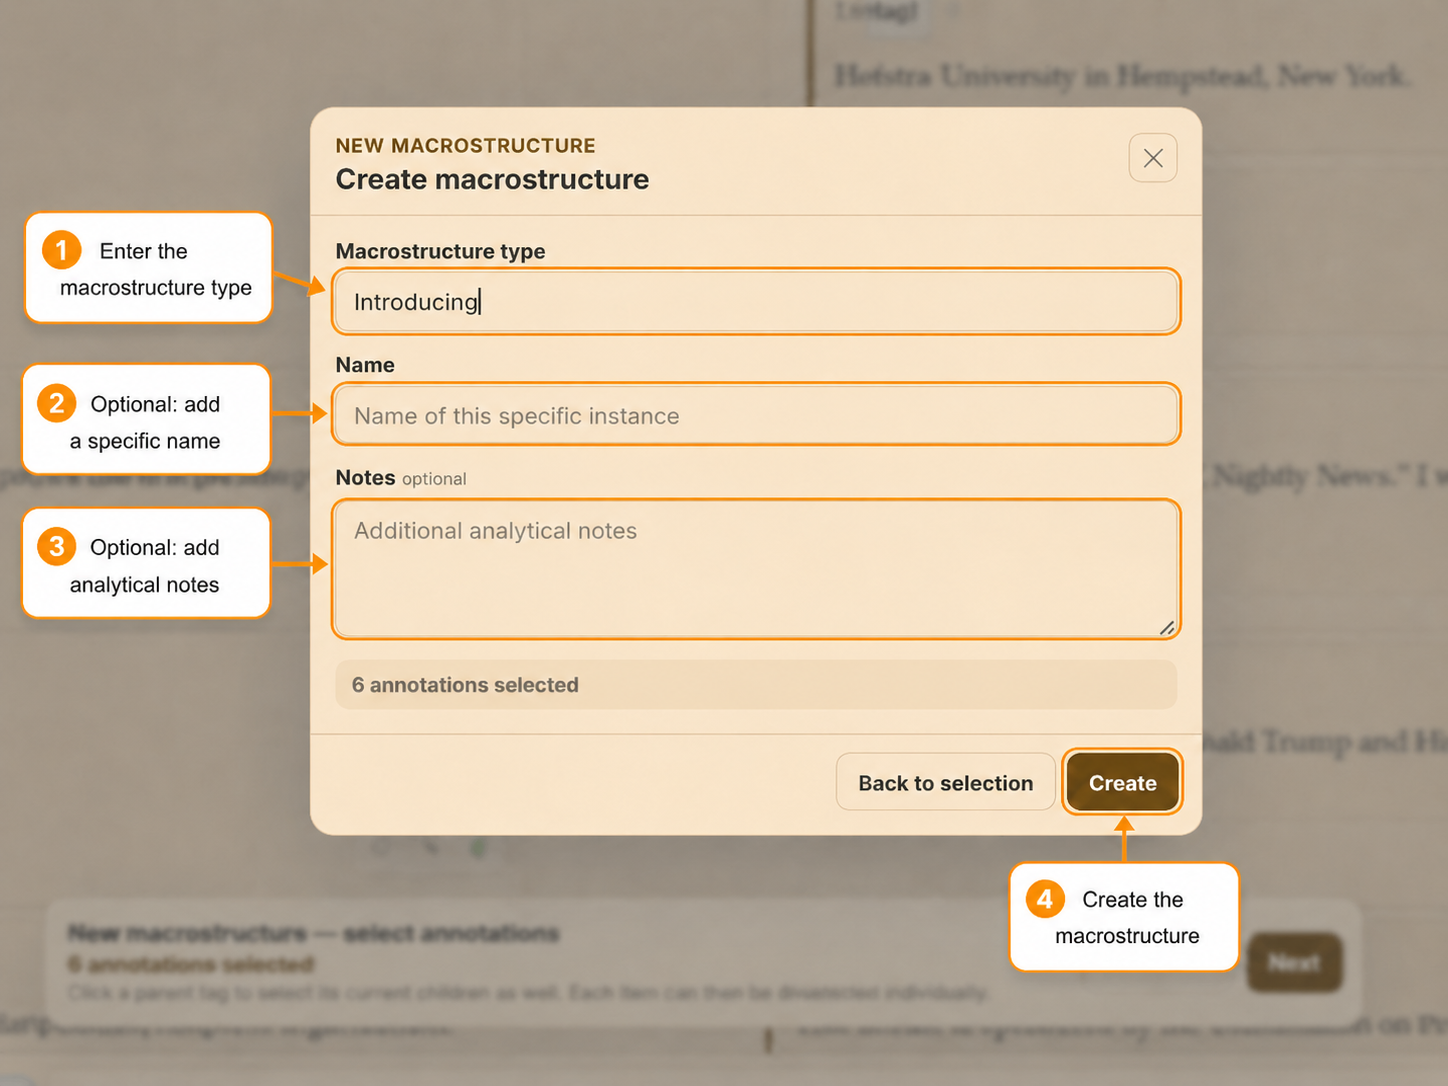
Open the Macrostructures menu and choose Create macrostructure.Select the annotations that should belong to the macrostructure, then click Next.Enter the macrostructure type and, optionally, a name and analytical notes. Then click Create.After creation, the macrostructure becomes visible in the annotation panel and assigned annotations receive its badge.
Annotation · 05
Creating relations
TMM supports two types of relations: (a) between annotations and (b) between macrostructures.
Relations connect two analytical objects: annotations or macrostructures.
To create a relation between annotations:
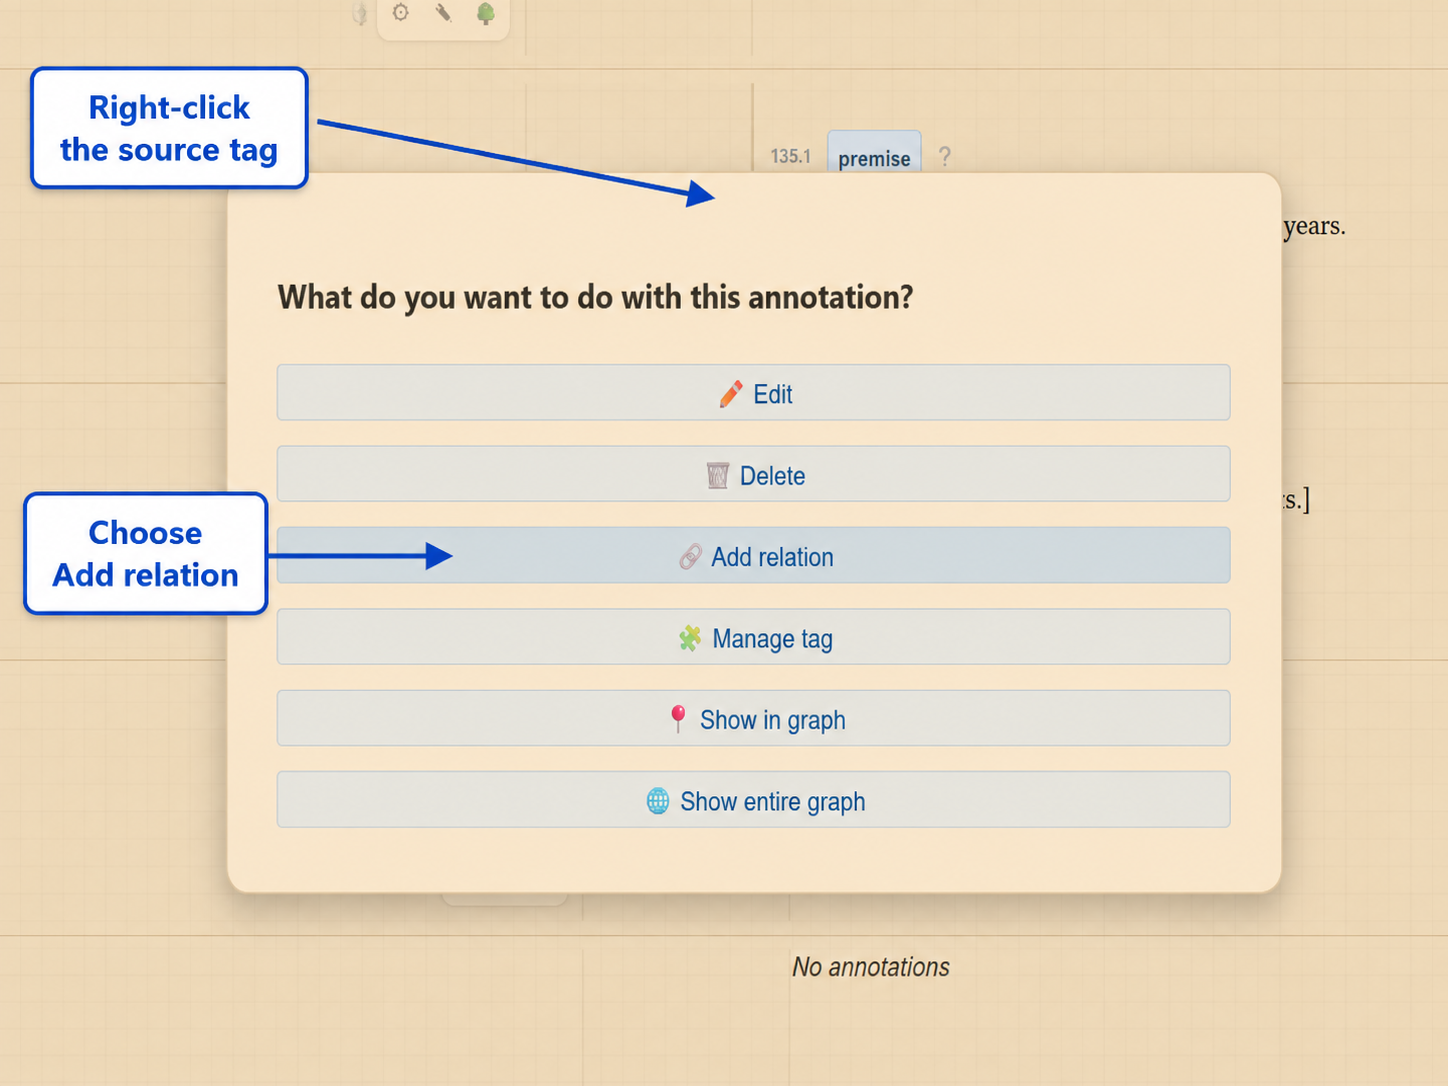
Right-click the tag pill from which you want the relation to start.
Choose Add relation.
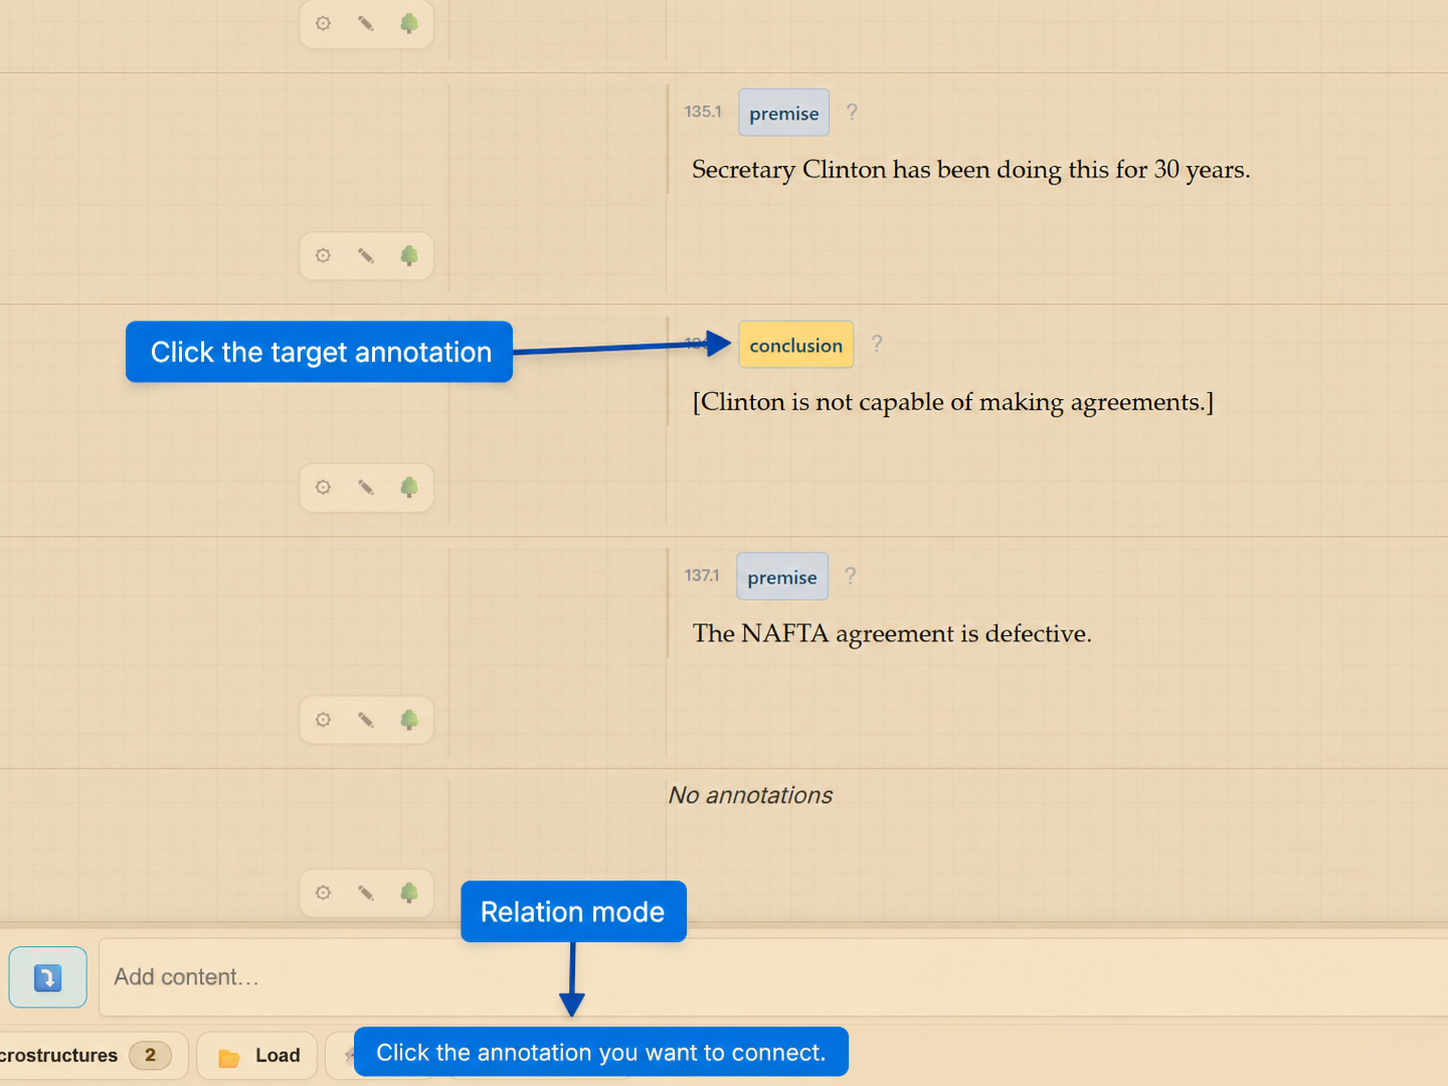
Click the target annotation that should be connected.
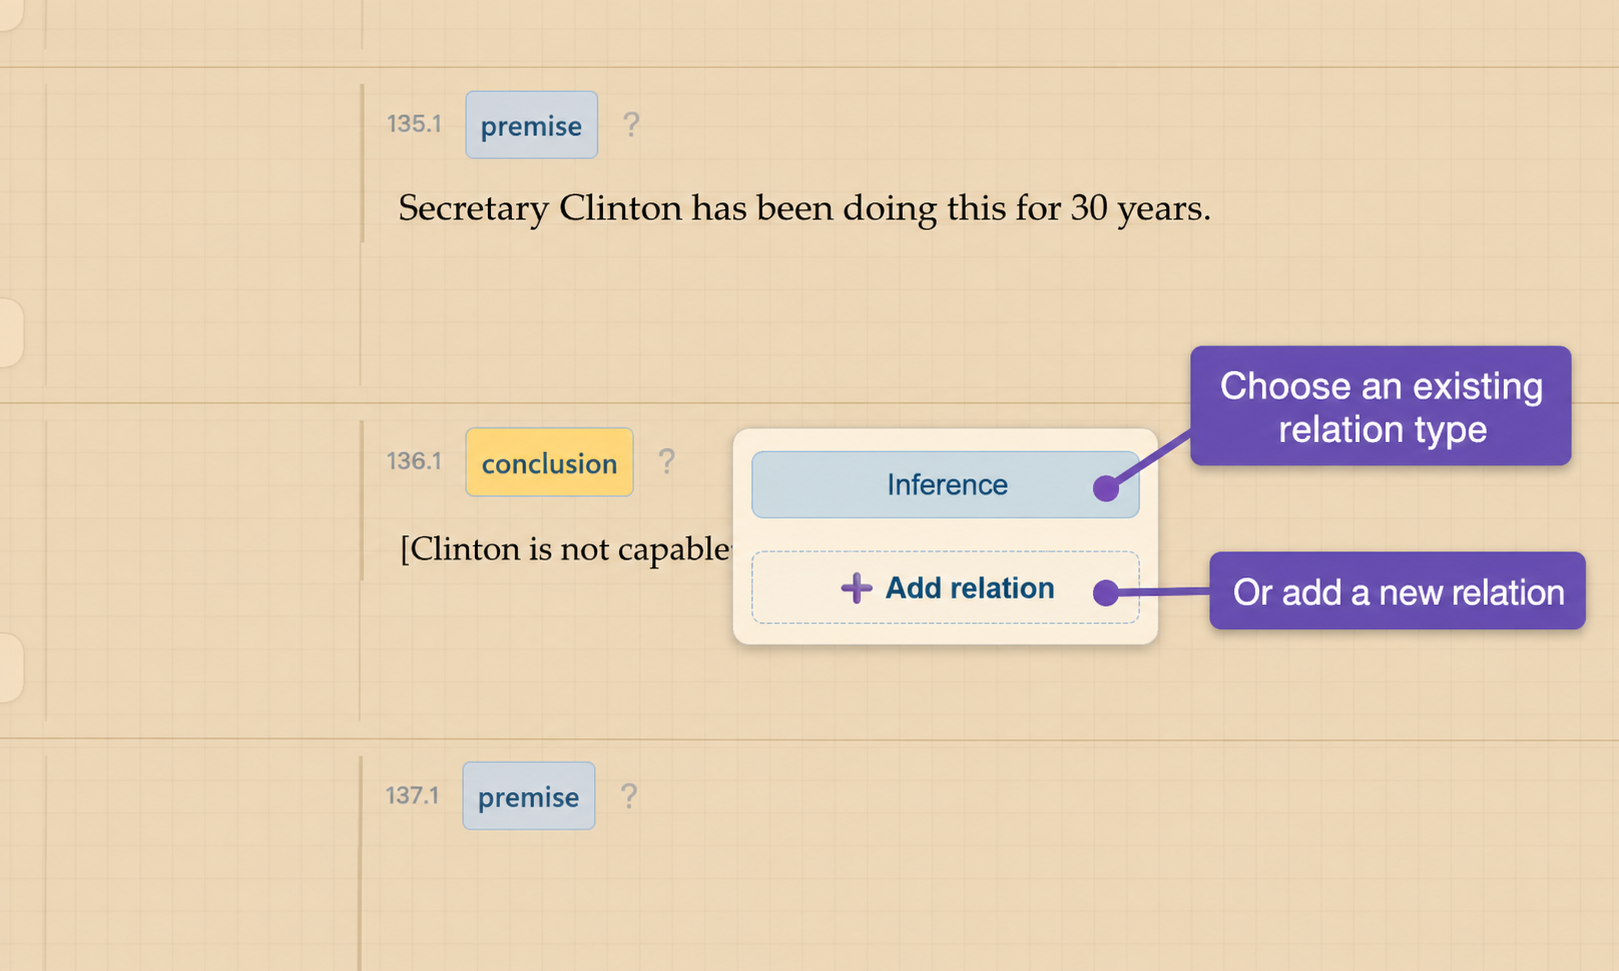
Choose a relation from the available list or add your own.
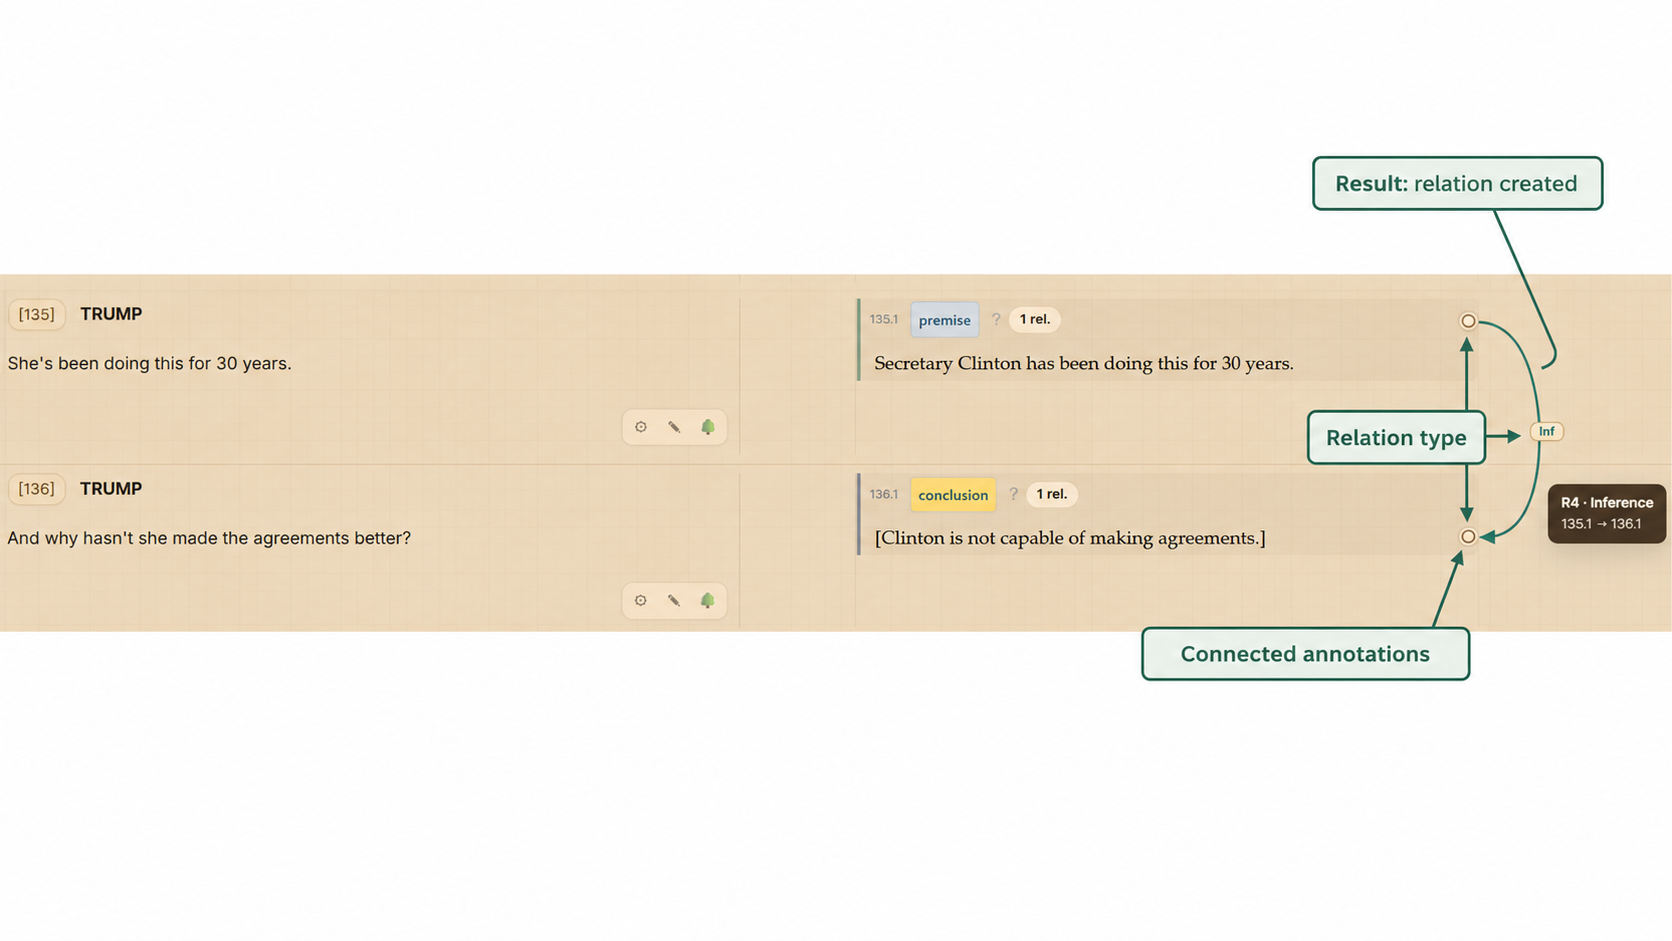
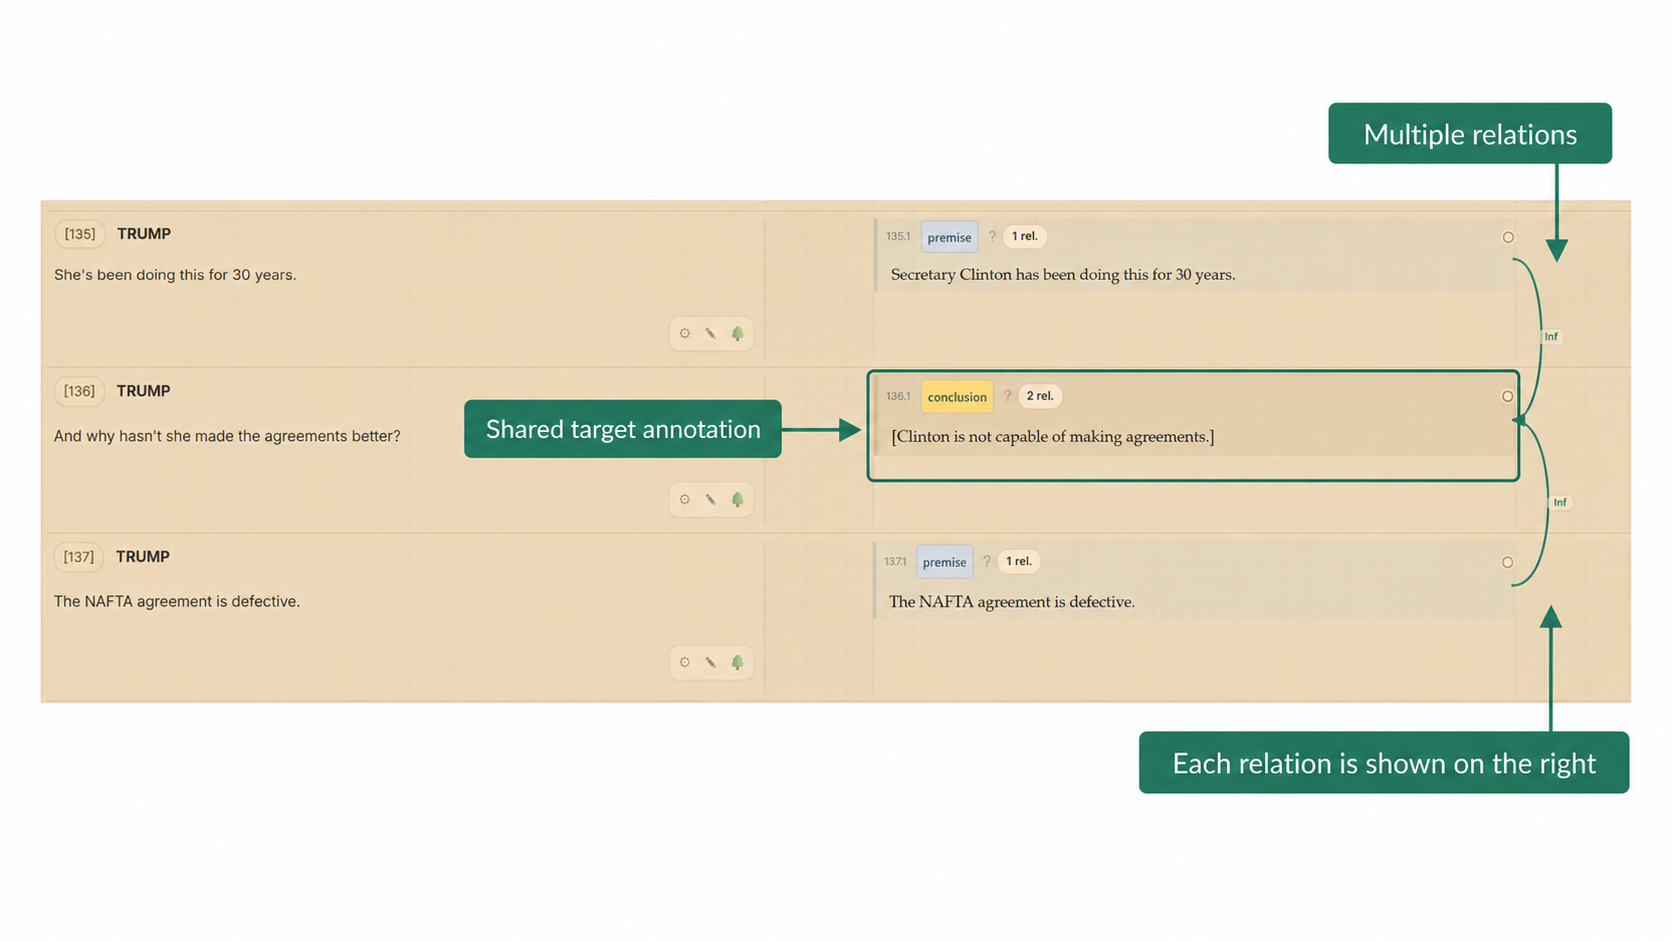
Right-click the source tag and choose Add relation.In relation mode, click the target annotation you want to connect.Choose an existing relation type or add a new one.After saving, the relation appears in the annotation panel.One annotation can participate in multiple relations.
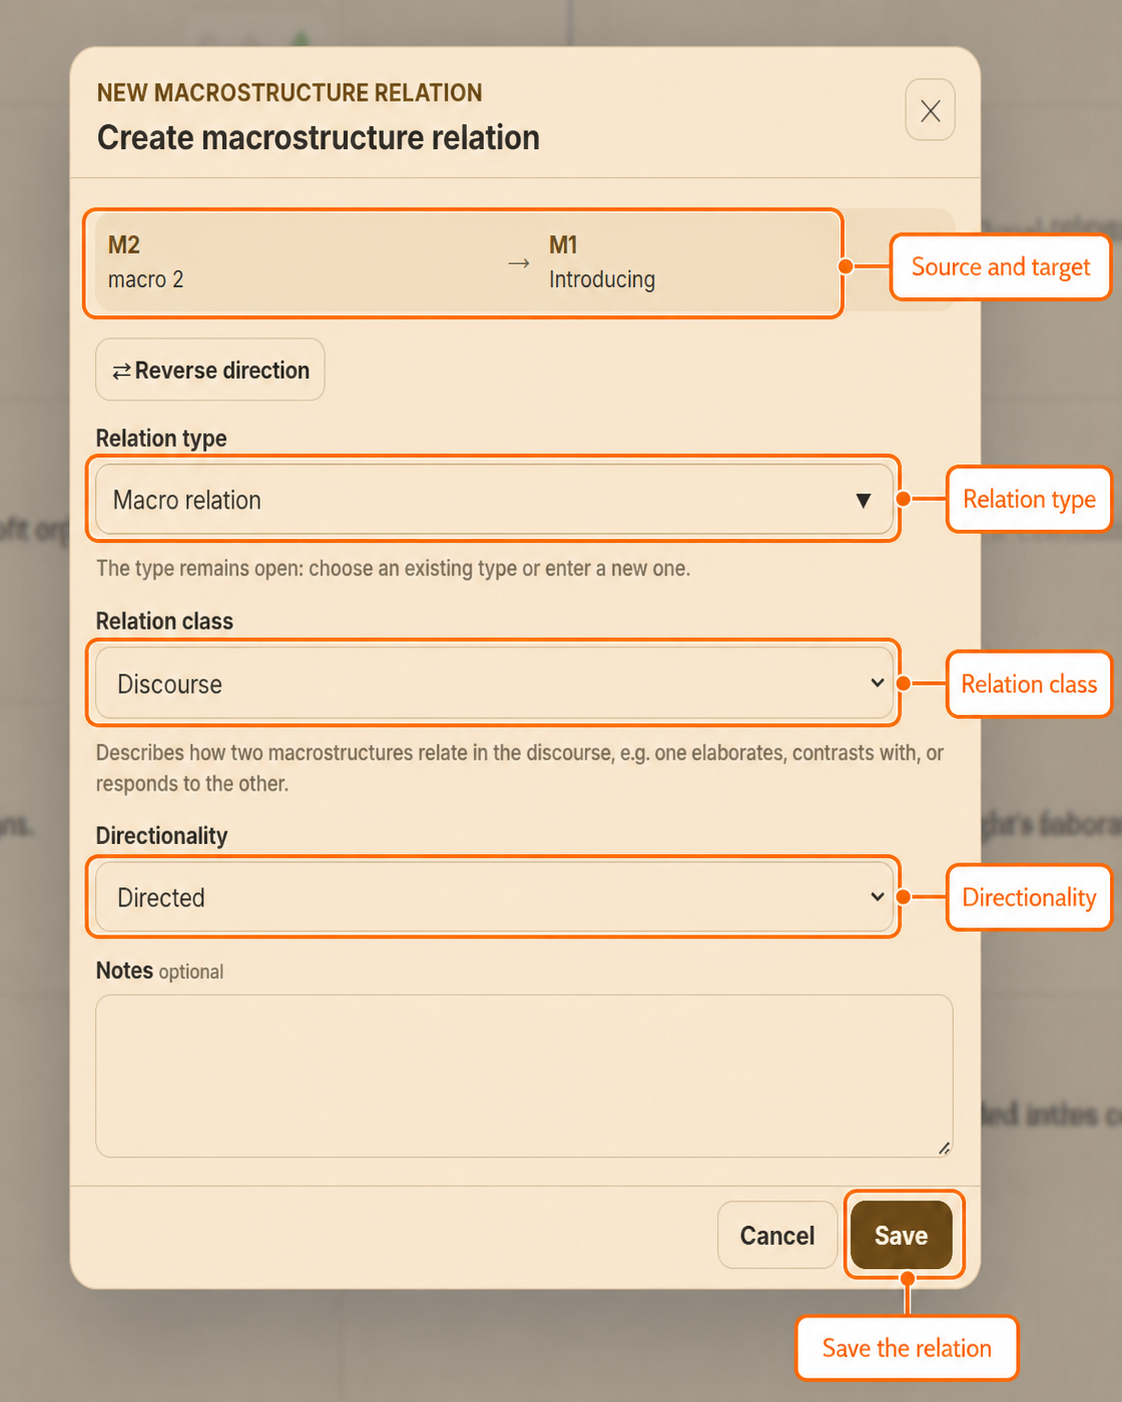
To create a relation between macrostructures:
Open the source macrostructure.
Choose Relation.
Select the target macrostructure, complete the form and confirm.
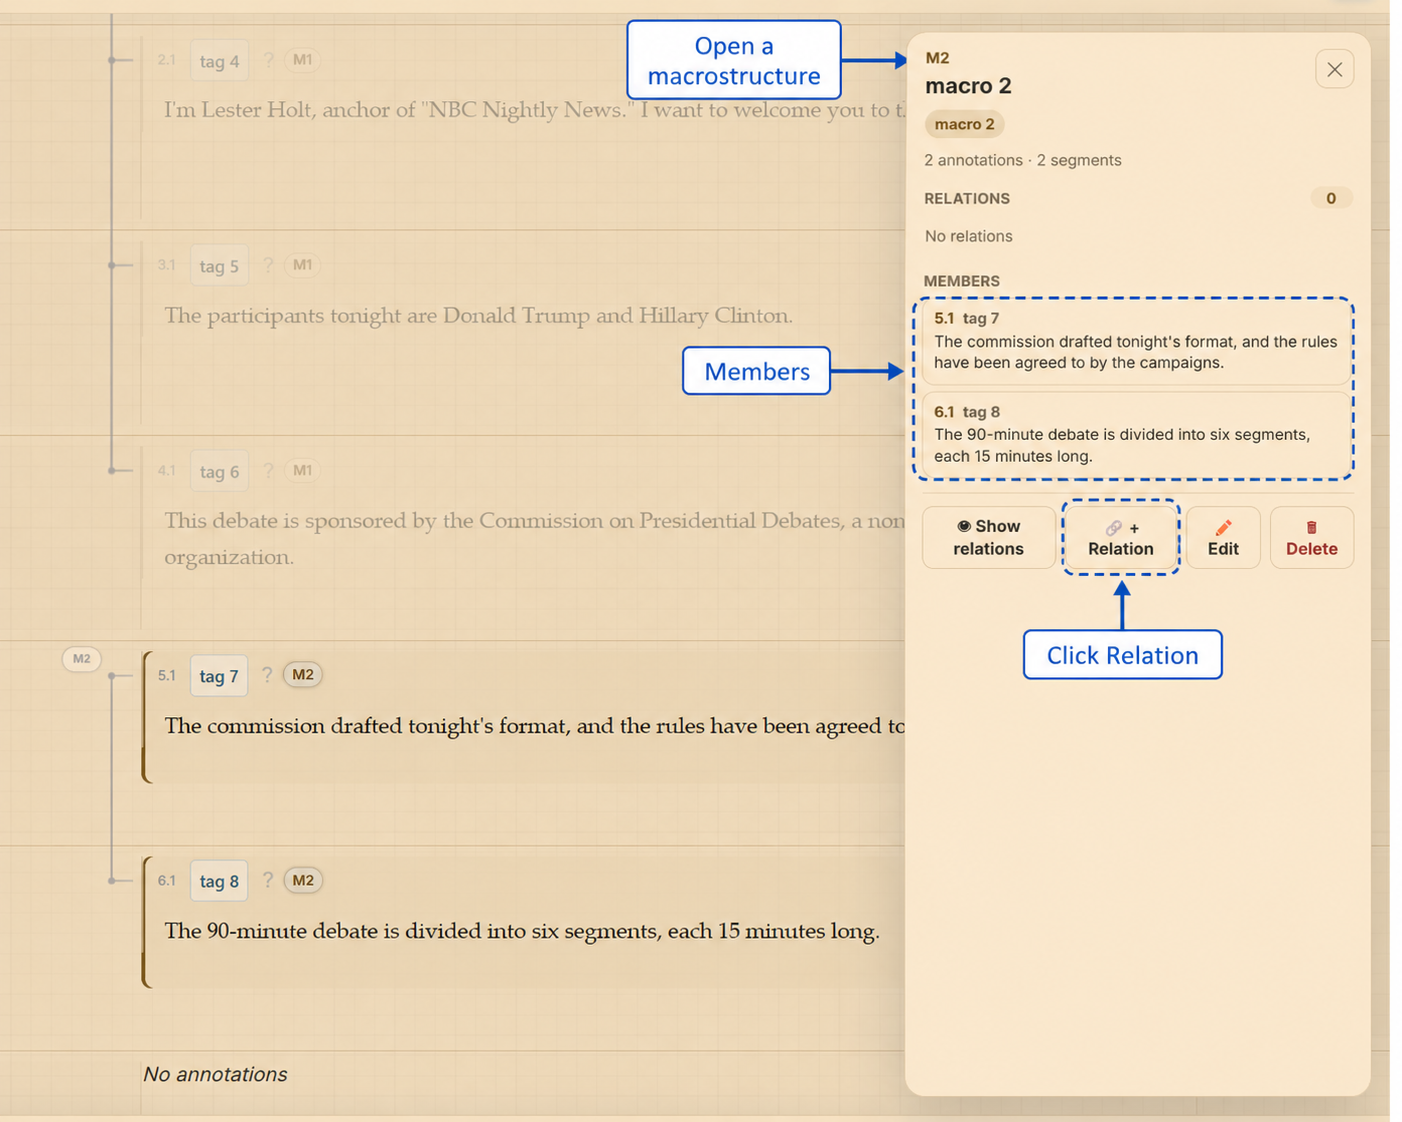
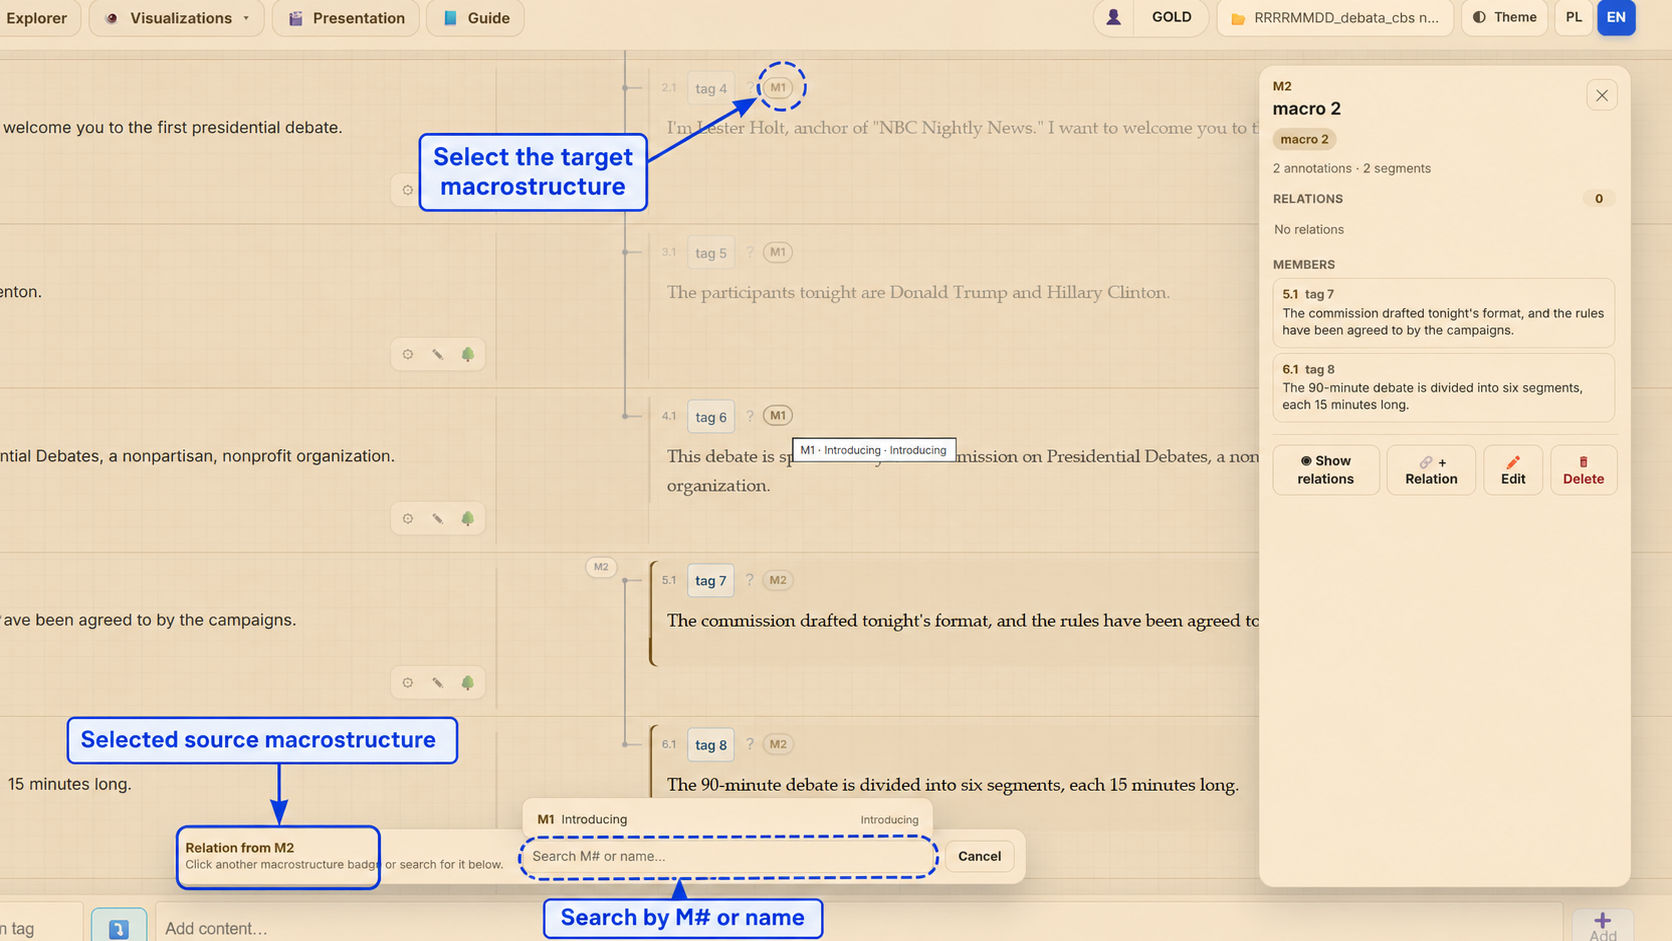
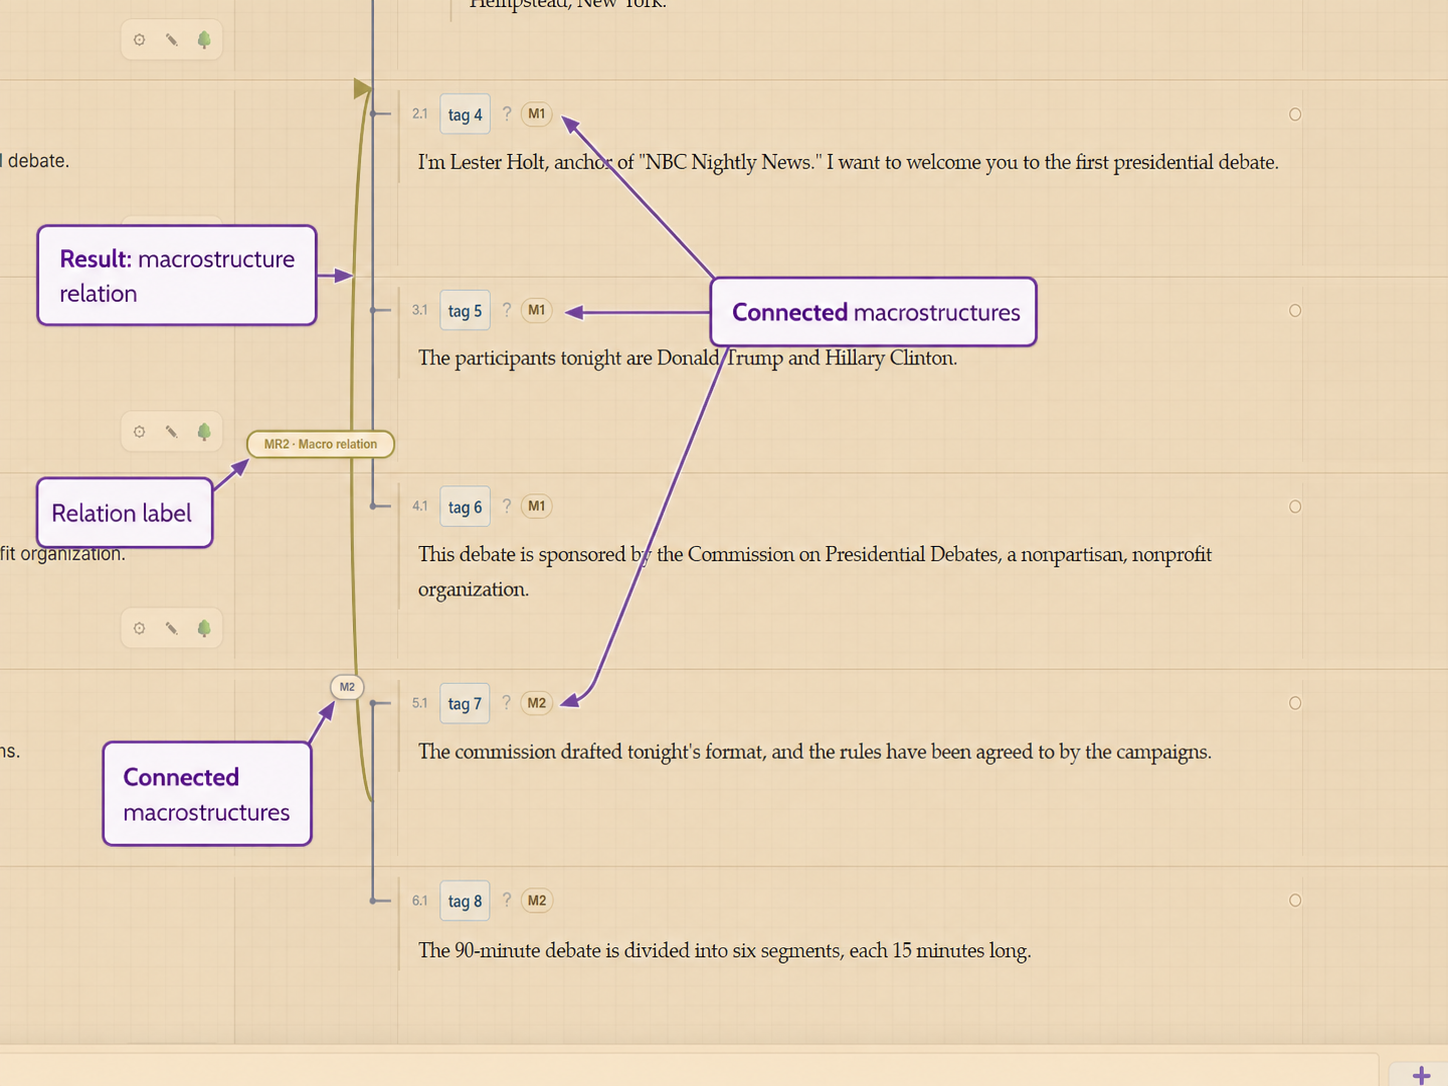
Open a macrostructure and click Relation in its side panel.Select the target macrostructure directly or search for it by M# or name.Fill in the relation form and click Save.After saving, the macrostructure relation becomes visible in the annotation panel.
Review and analysis · 01
Reader
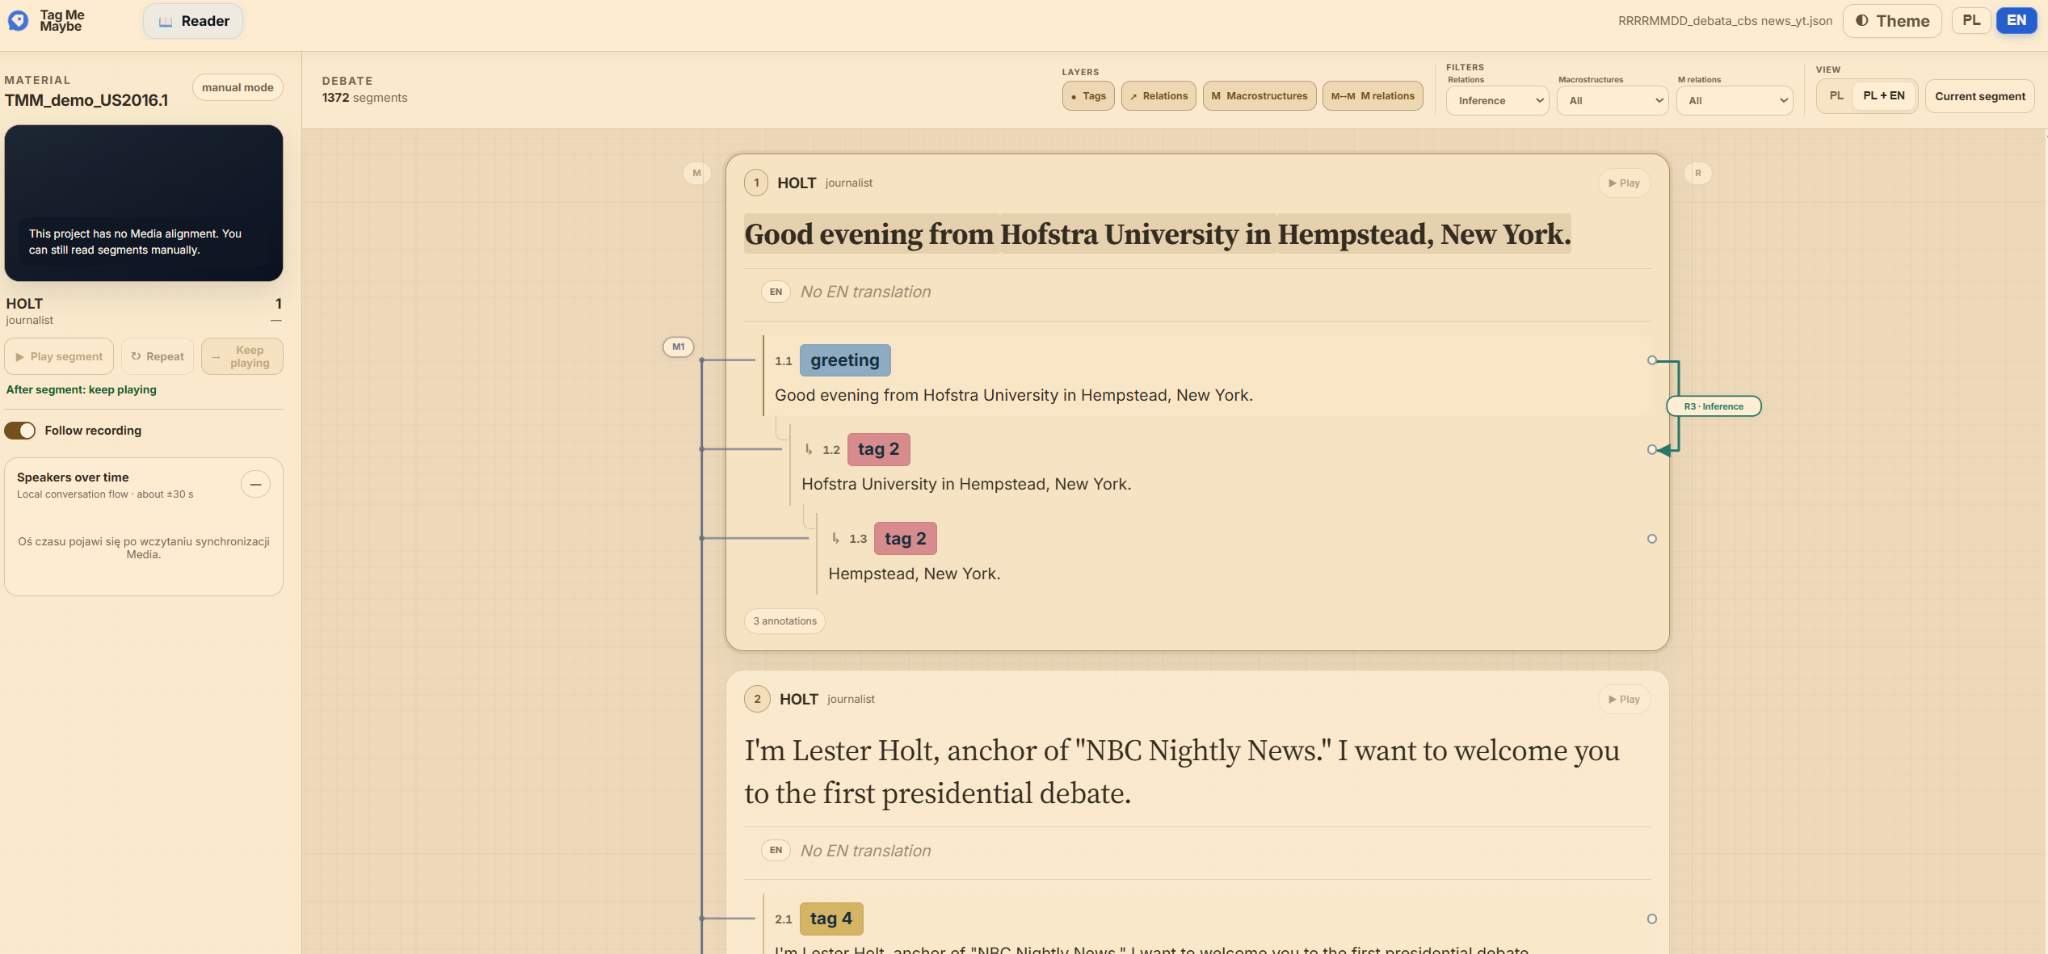
The Reader lets you view annotated material in a slightly different way than in the Annotation module. It includes various filters that let you focus on selected objects.
The Reader brings together material context, annotation layers, filters and visible relations in one view.
Use filters and layer switches to focus on selected relation or macrostructure types.
Switch between source-only and bilingual reading when translations are available.
Follow the recording to keep the current segment aligned with the media timeline.
Review and analysis · 02
Explorer
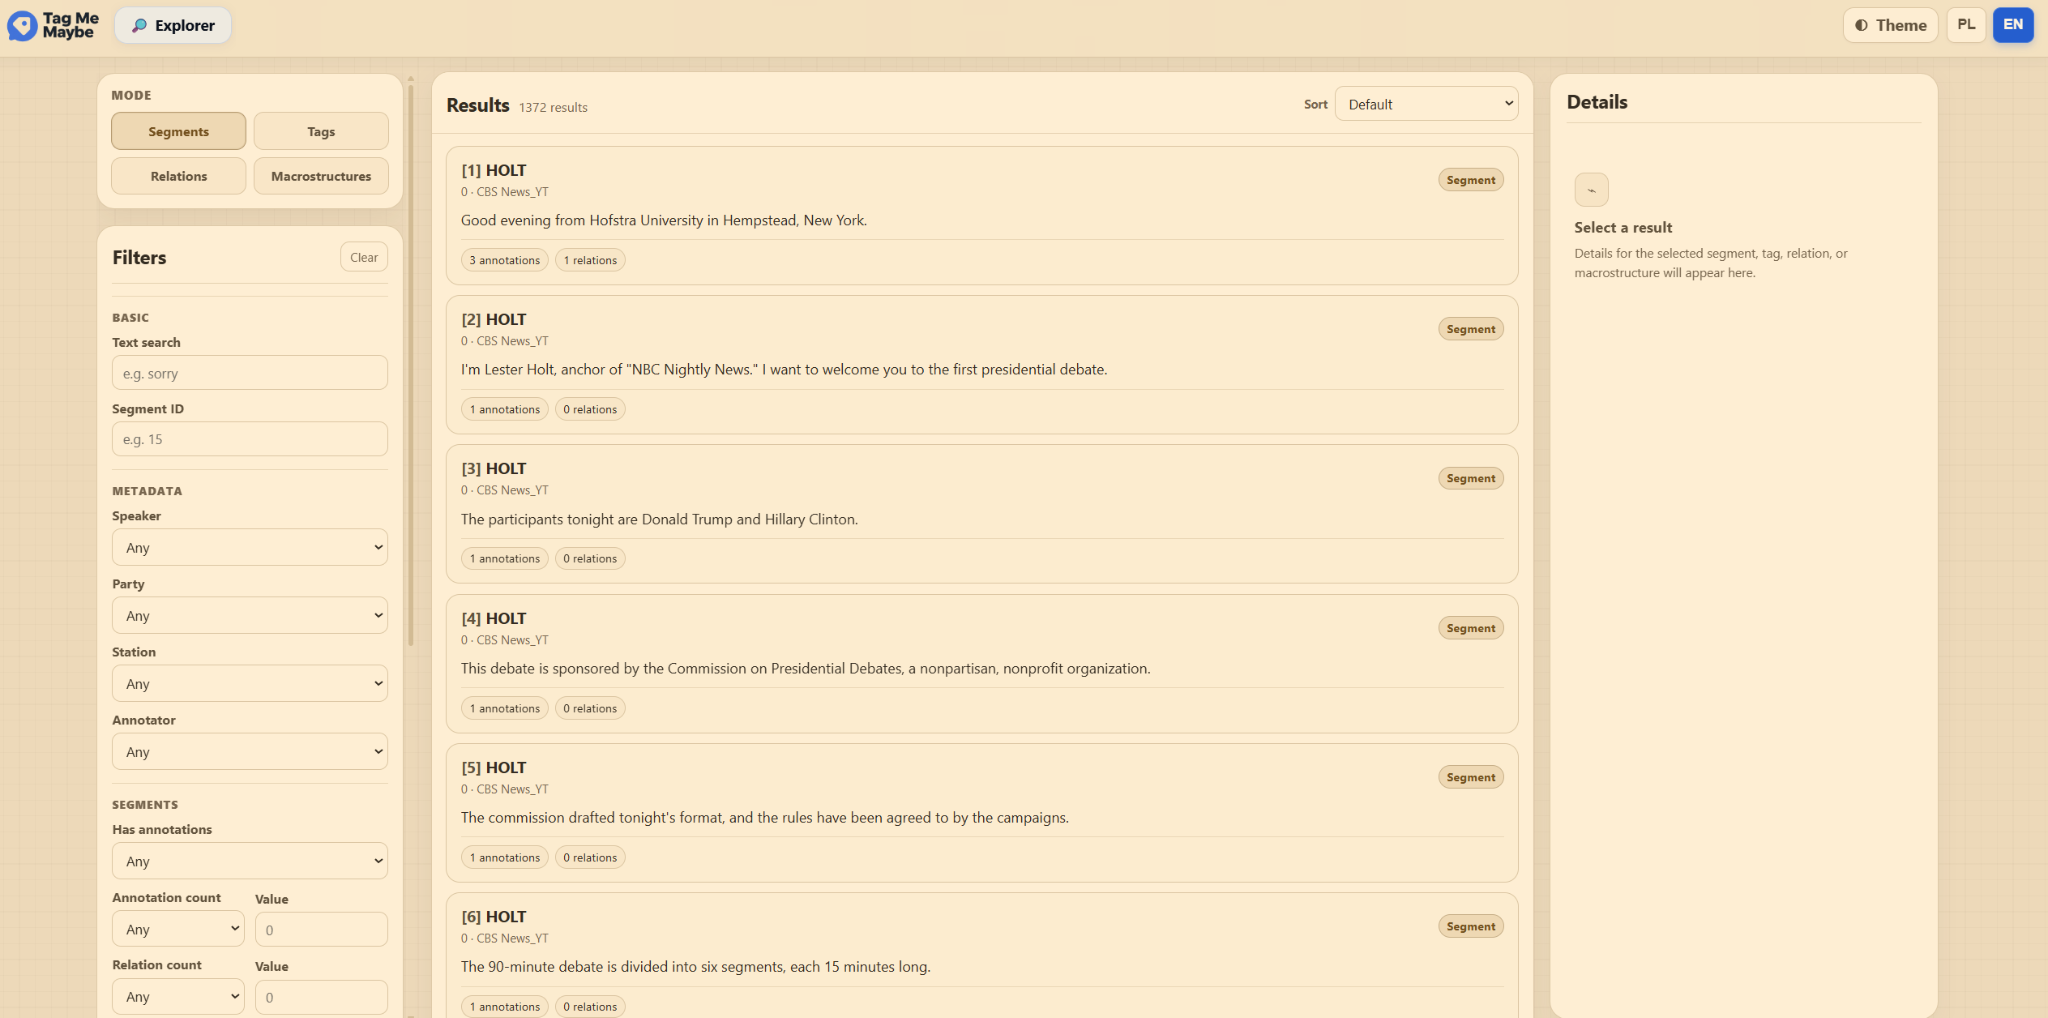
Explorer is an advanced search workspace. It lets you precisely search and browse segments, tags and relations.
You can switch between different browsing modes and filter results, for example by tag, speaker, segment, tag content or metadata.
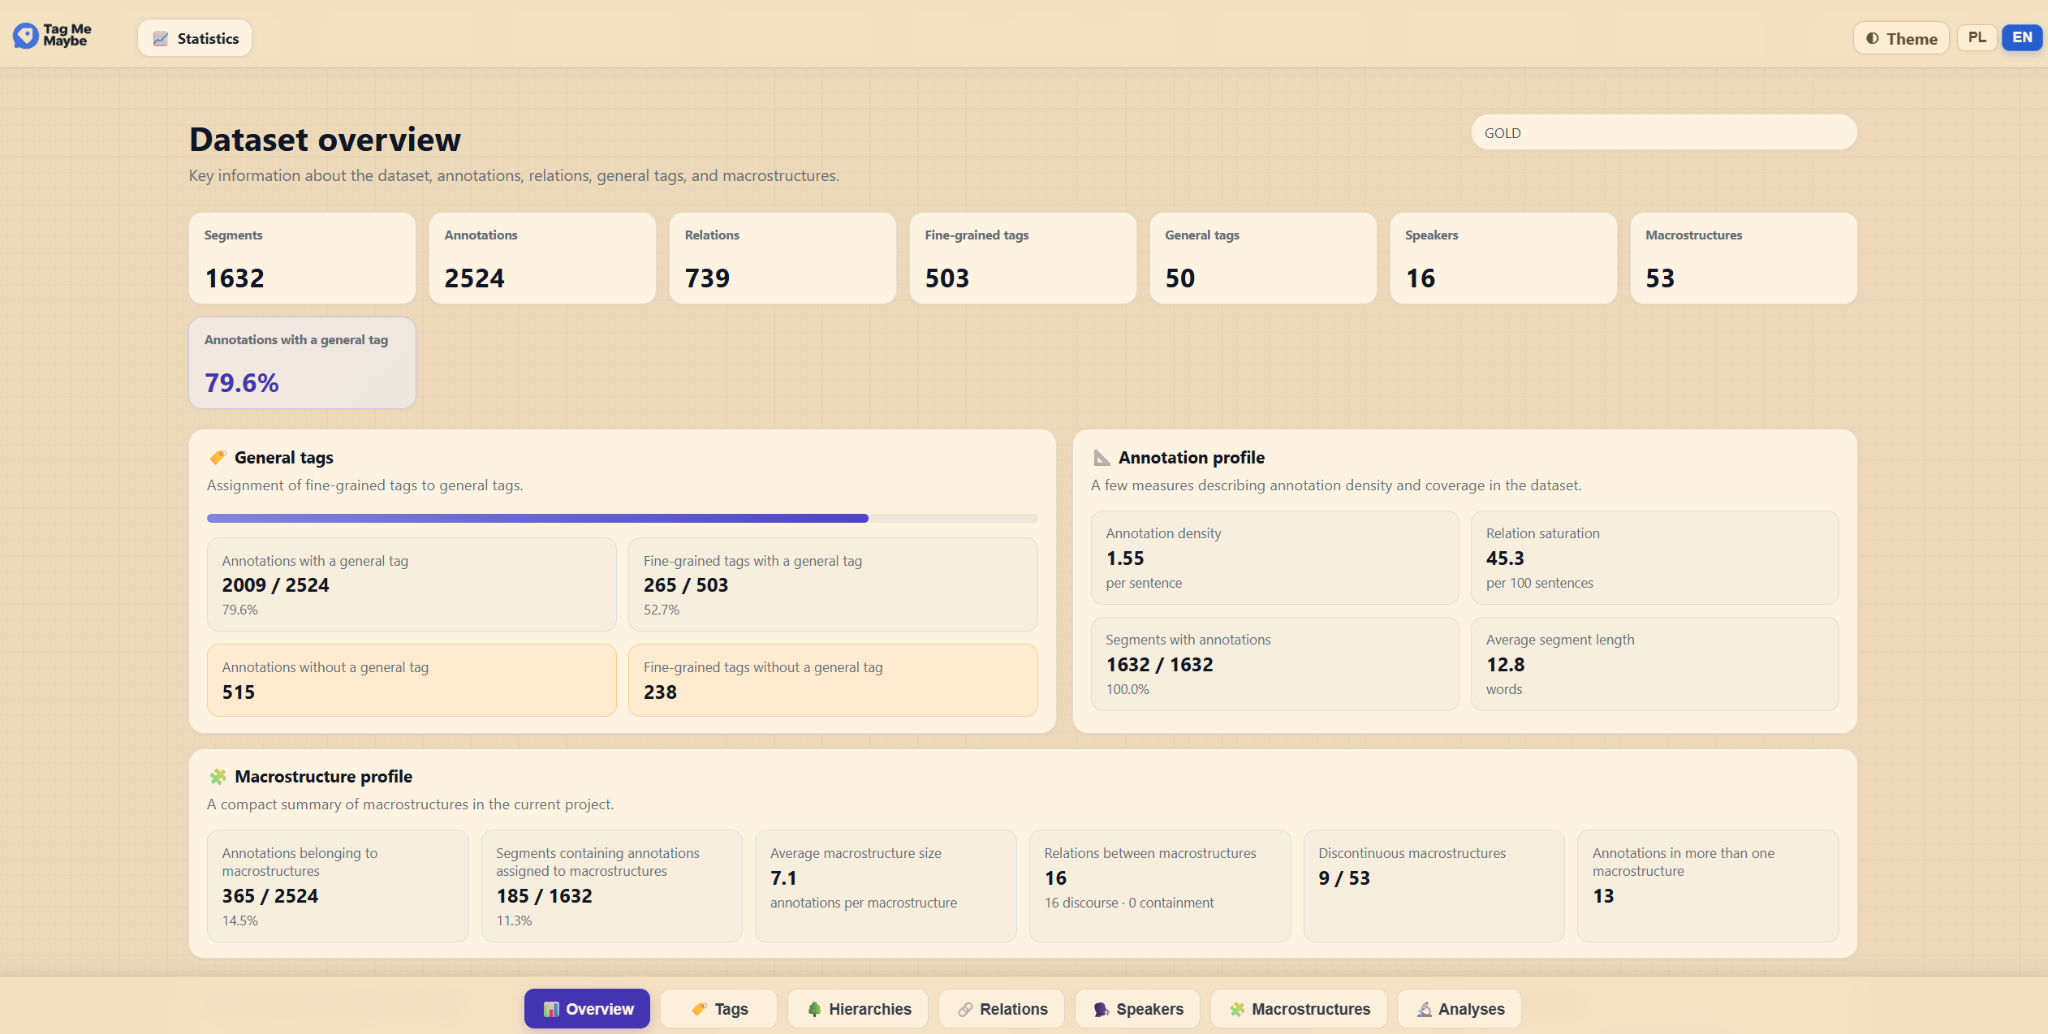
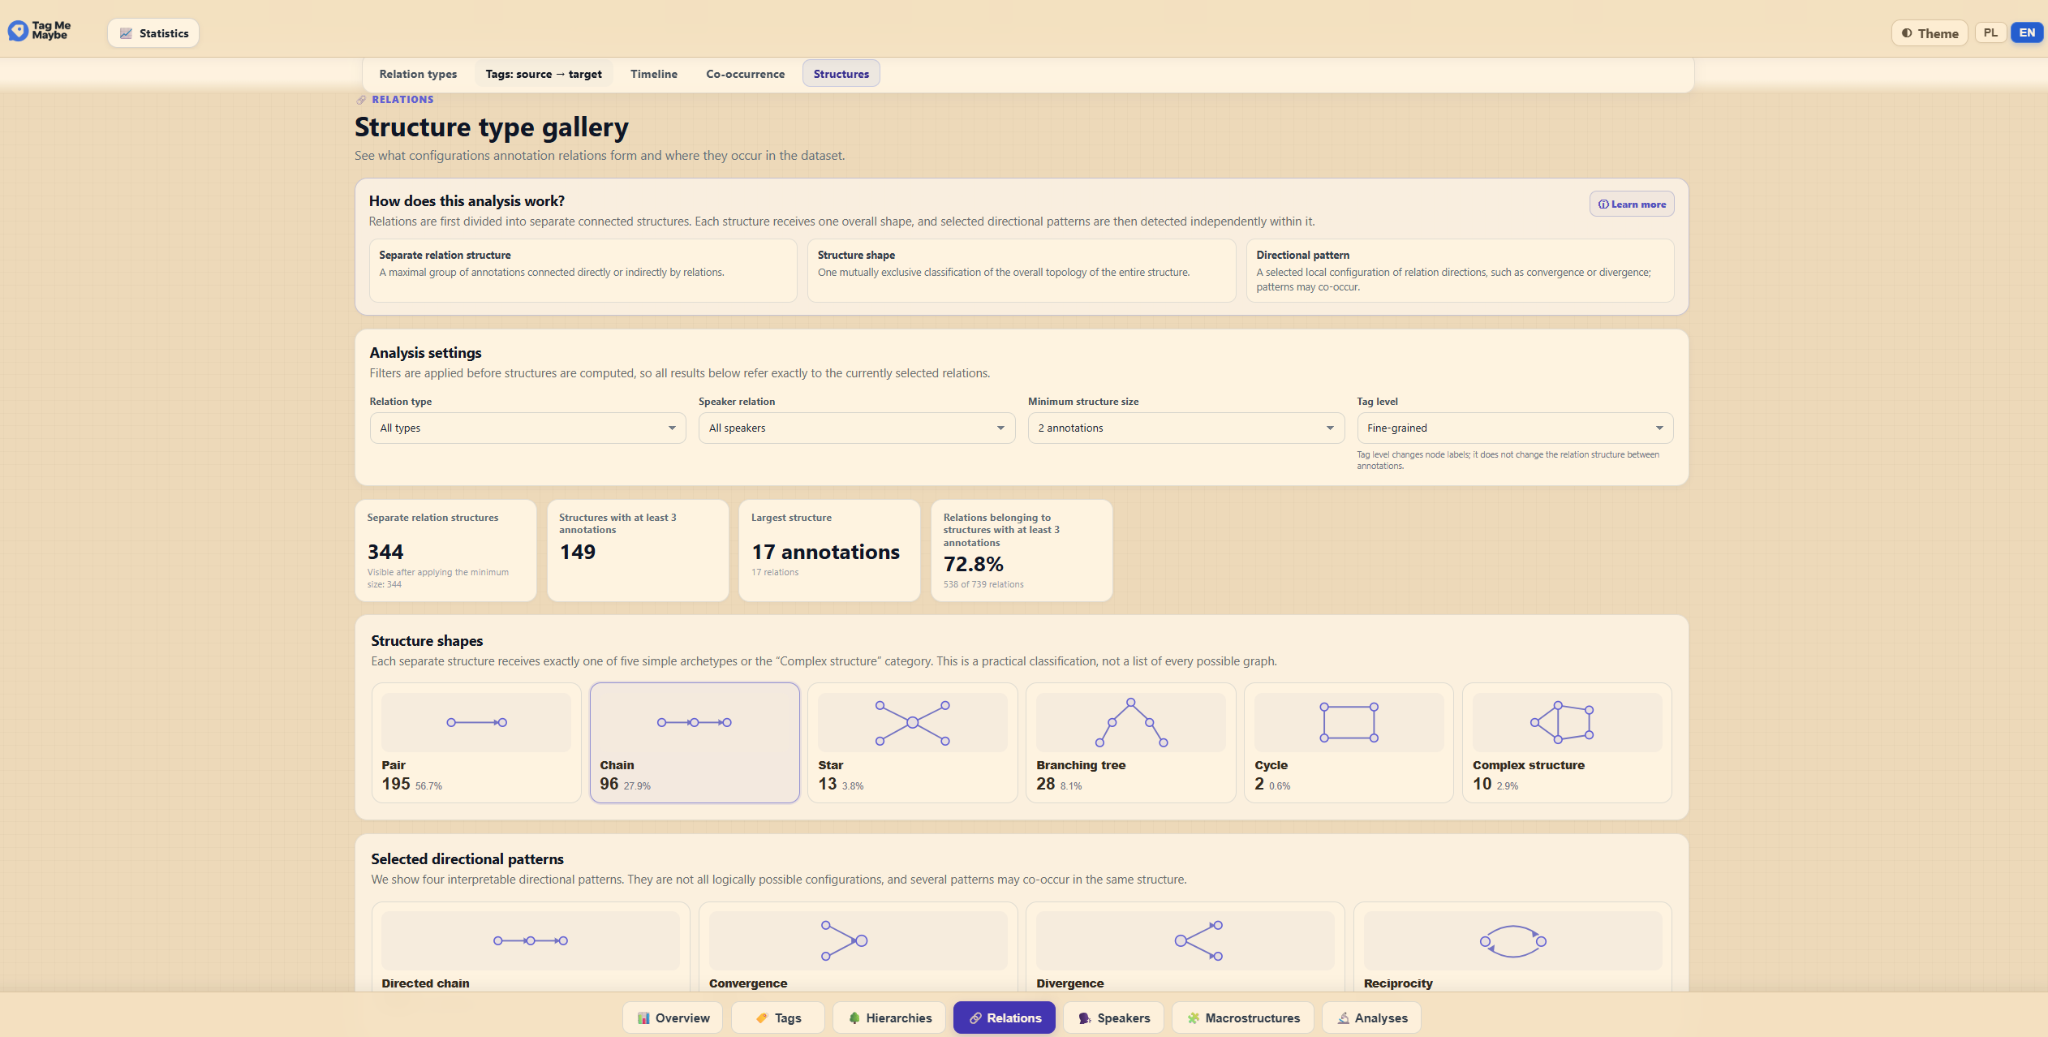
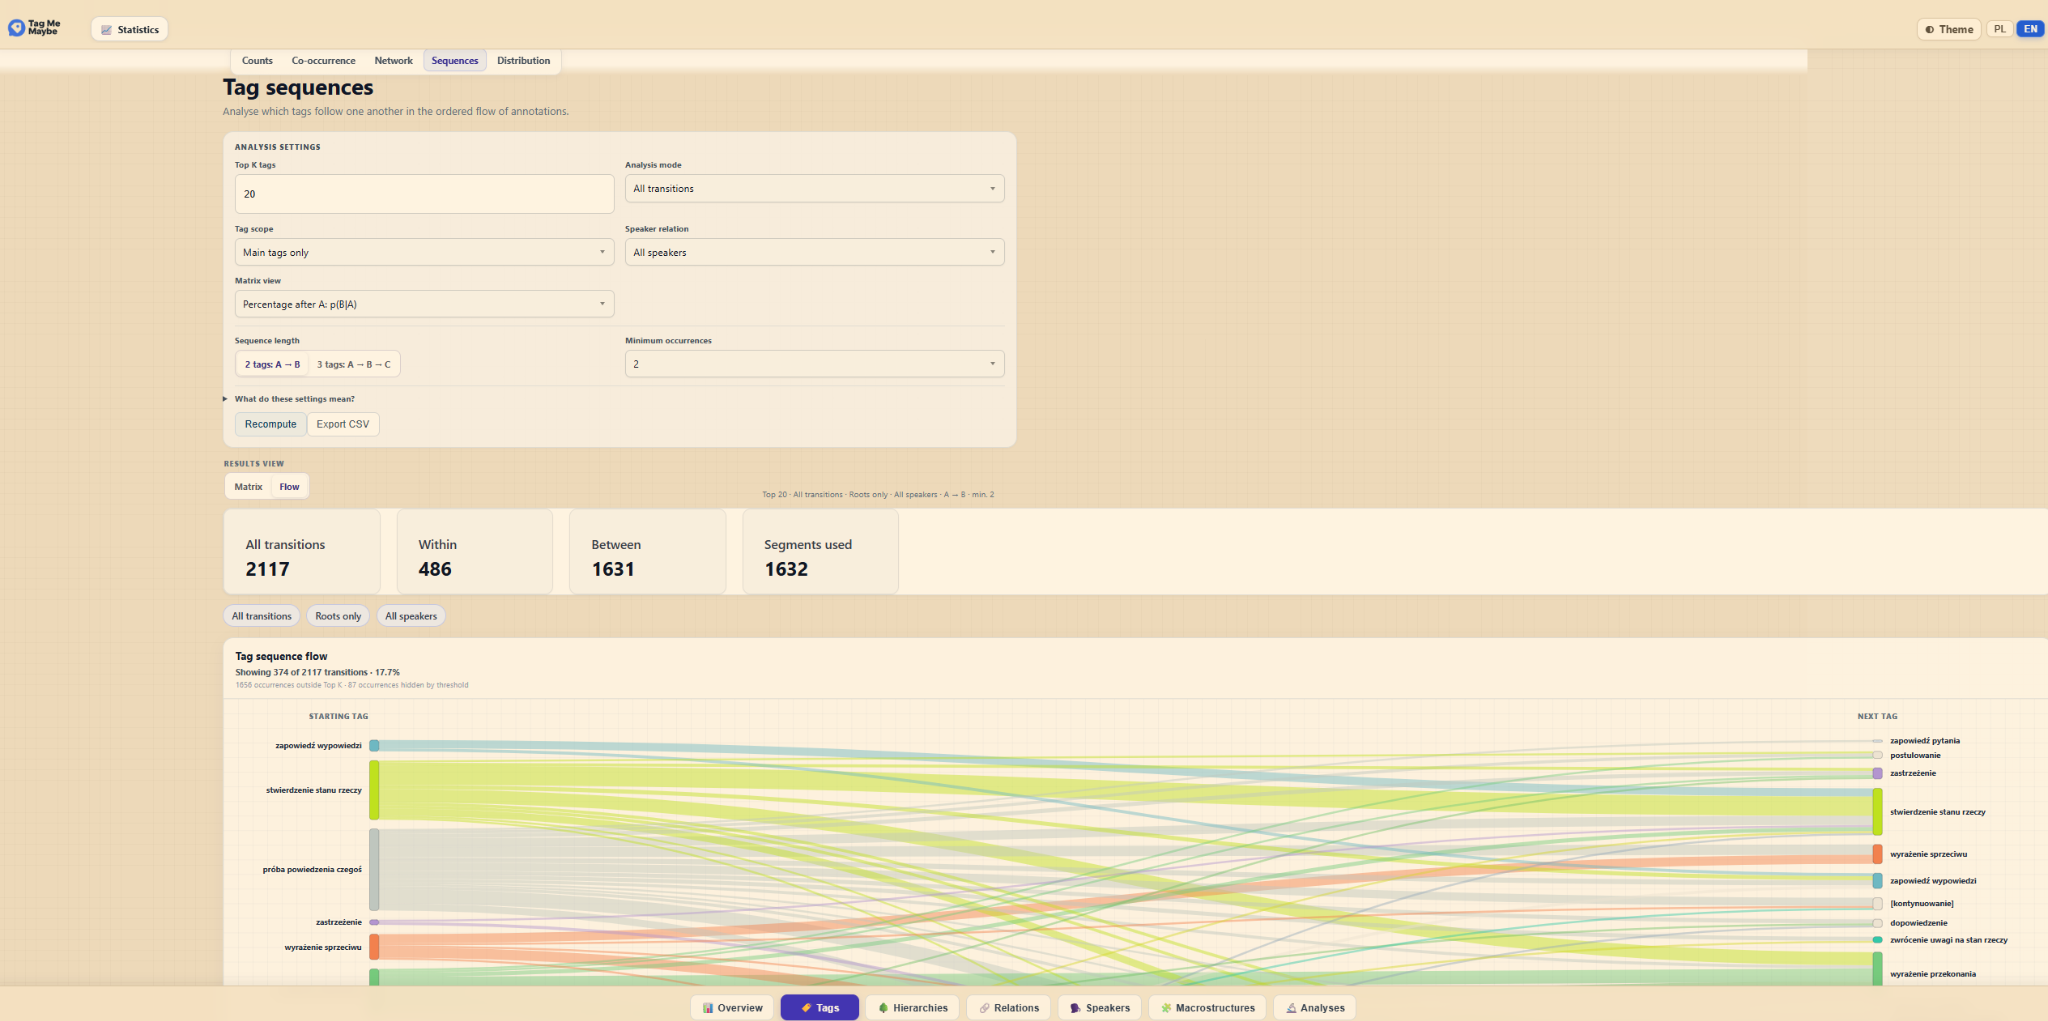
The Overview tab summarises the dataset, annotation profile, general tags and macrostructure indicators.The Relations → Structures view shows the most common relation shapes and directional patterns in the dataset.The Tag sequences analysis helps trace which tags tend to follow one another in the ordered flow of annotations.
Review and analysis · 04
Graphs
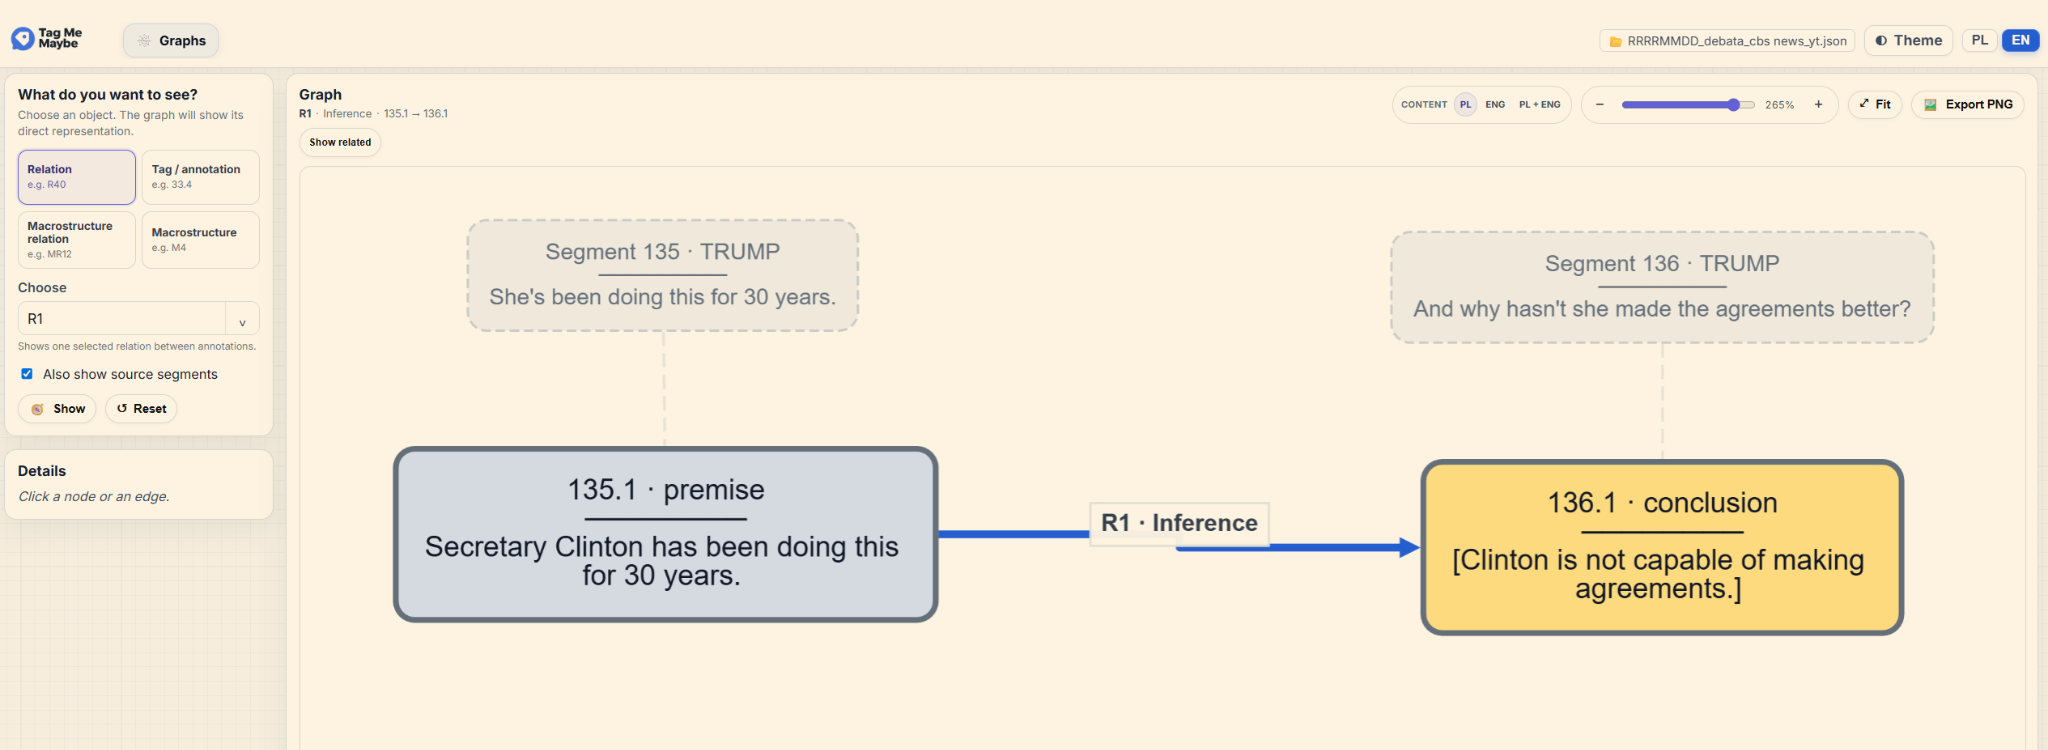
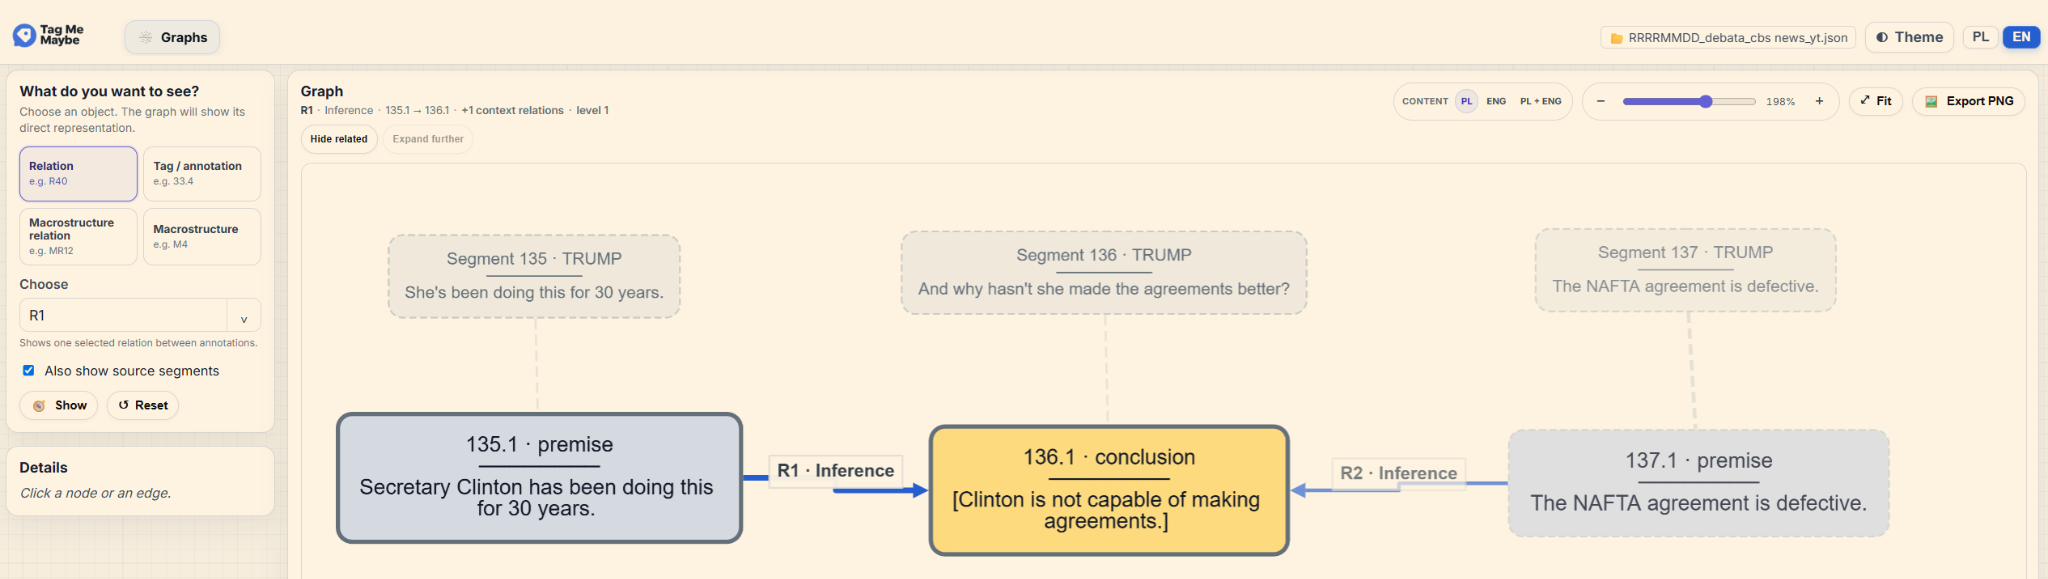
The Graphs tab shows annotations and relations in a graph-based form.
It offers a more user-friendly view of relations between tags.
It is especially useful when you want to see the network of connections between tags. Filters are available to configure the relation view as needed. It is worth using when relations between tags are dense.
The Graphs view can display a selected relation as a clear graph connecting its source and target annotations.You can also expand the context to see related annotations and additional connections around the selected relation.
Presentation and data · 01
Presentation
Presentation mode is designed for showing the dataset to an audience. It uses larger typography, controlled layers and layouts intended for a screen or projector.
Presentation mode combines large reading typography, media context and a structured analysis panel in a projector-friendly layout.
Presentation and data · 02
Export and publication version
Export
Export as a JSON file
An exported JSON file is also a complete save of the project. Create exports as often as possible; they are an insurance policy in case browser storage becomes corrupted.
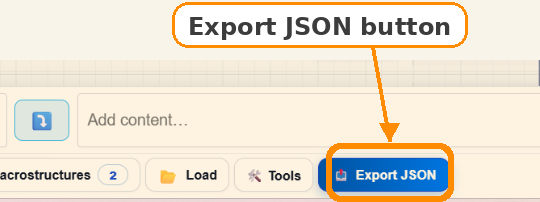
Use the Export JSON button in Annotation to save the complete project as a JSON file.
Prepare dataset
Prepare a publication version
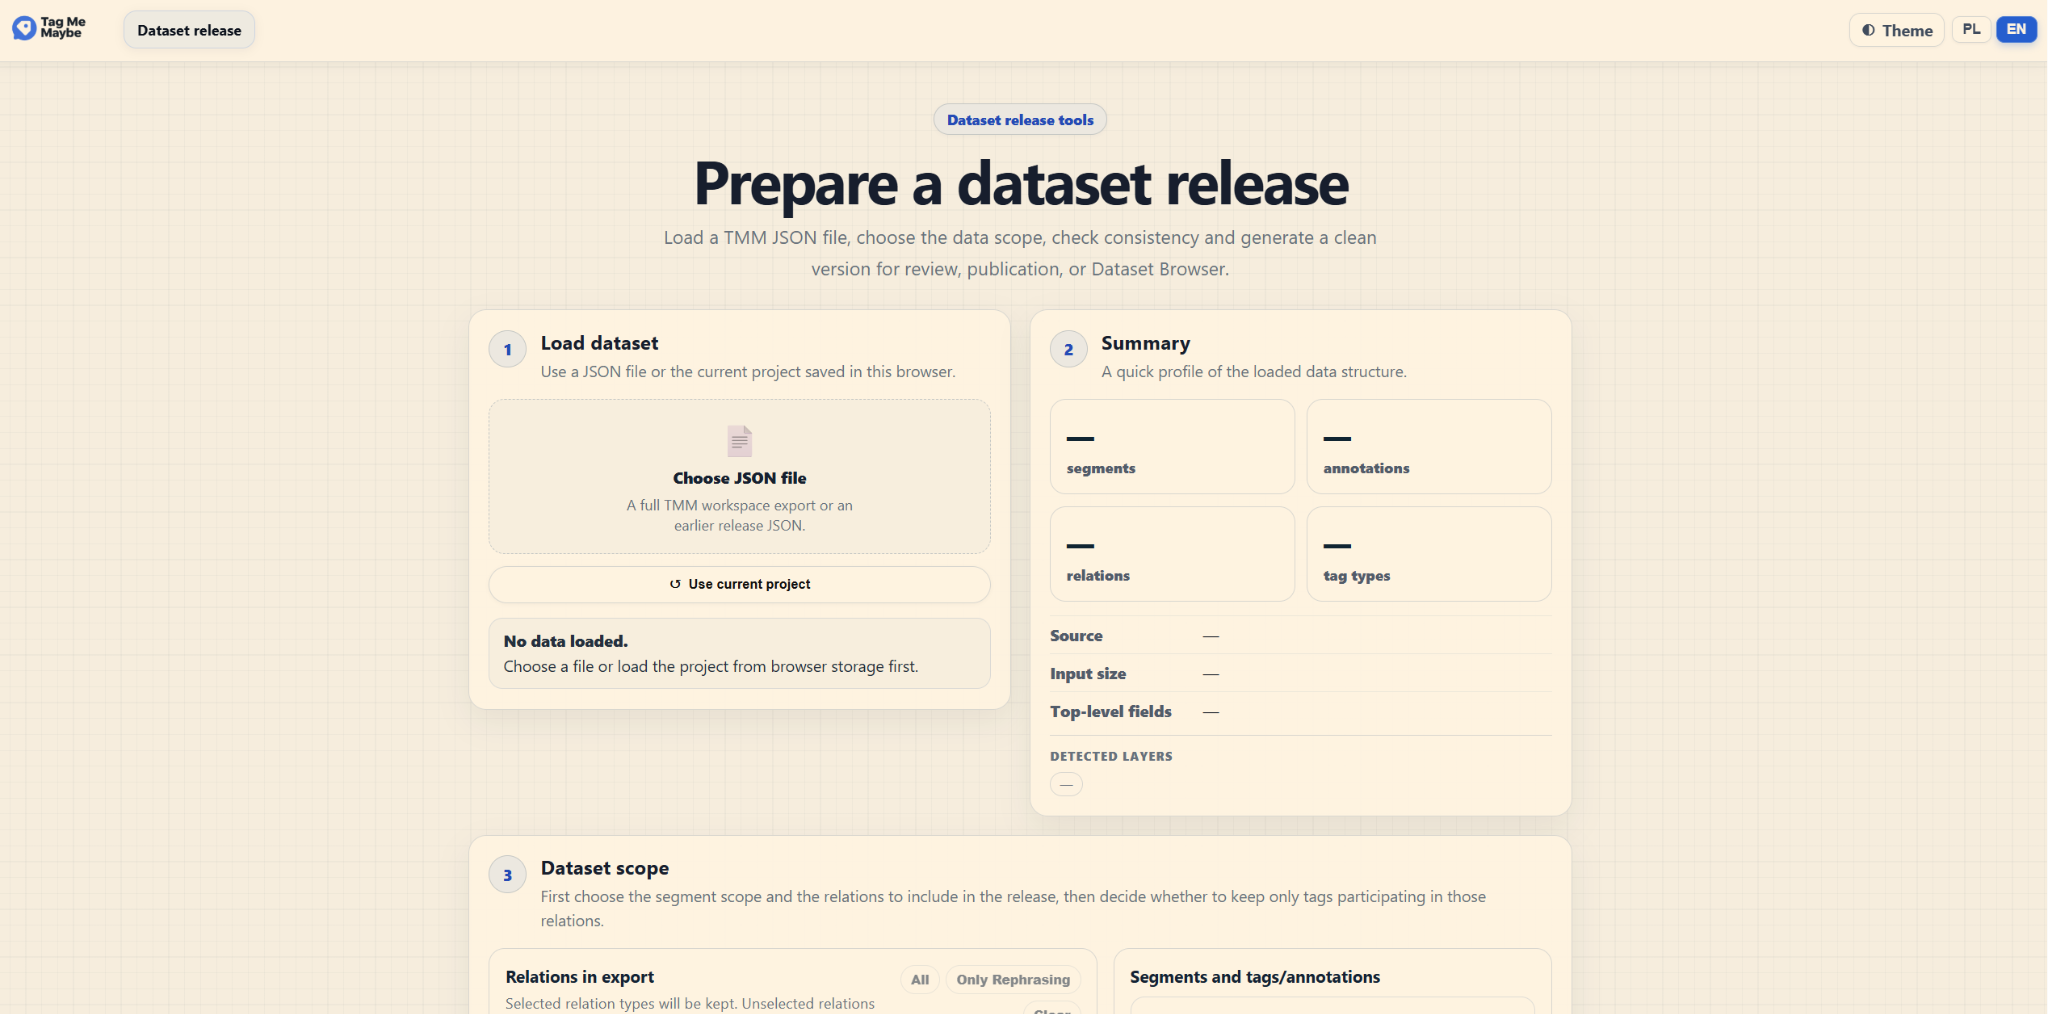
Using this module, you can decide which elements you want to remove from your dataset.
The dataset release module helps you load a file, inspect its structure and prepare a clean publication-ready release.Open Publication Version tools
Presentation and data · 03
Good practices
Save your work regularly.
Use one of the available LLMs if you want to prepare your own files quickly; they should handle this task without major difficulty.
When importing raw text from .xlsx, make sure the file has the expected structure.
Avoid having more than one TMM window open at the same time.
It is worth using modules other than Annotation mode, as they can help reveal different kinds of annotation problems.
A single segment can contain multiple annotations. This is useful when one utterance performs more than one function.